
If you’re a business owner looking to maximize every dollar you spend on acquisition, you’re in the right place. We’ll show you how to increase customer lifetime value with three high-impact levers that deliver immediate ROI. By the end of this guide, you’ll know exactly what to test, how to diagnose gaps in your system, and which metrics to monitor for real growth.
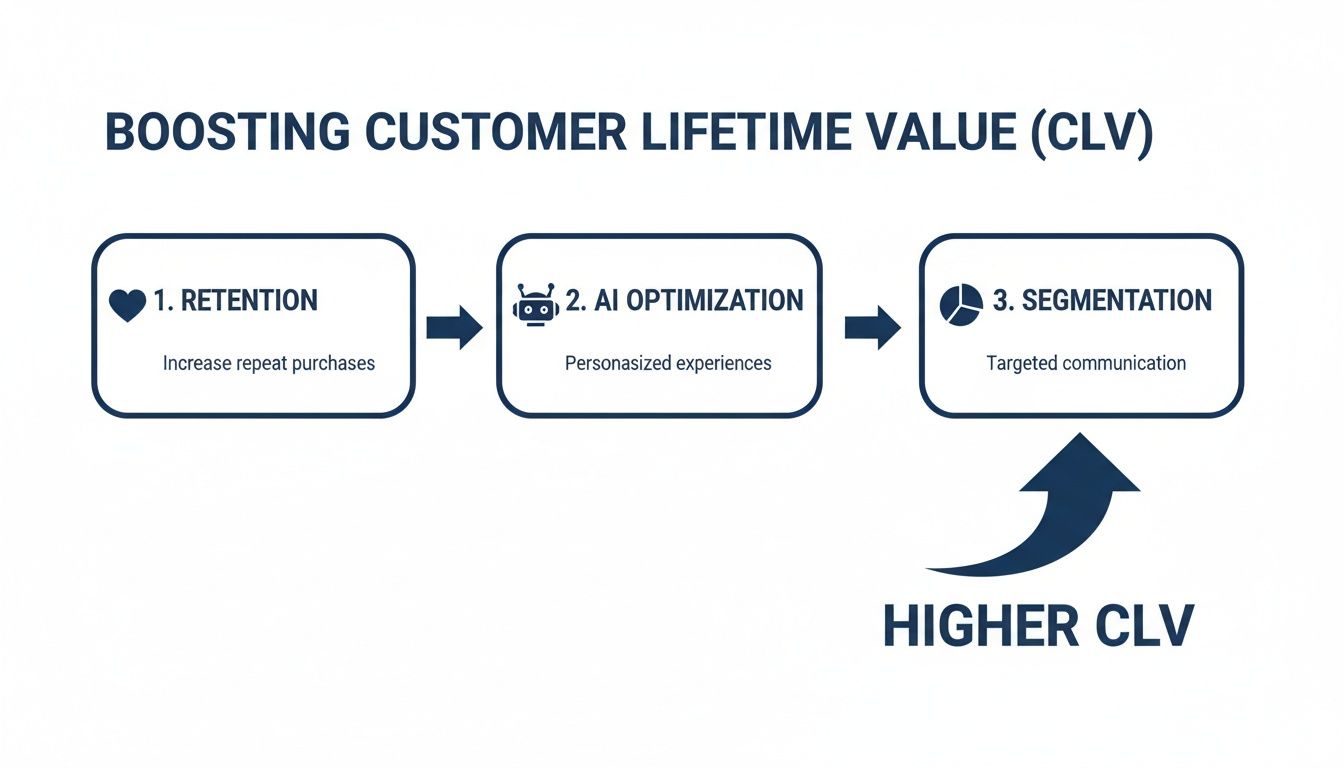
High-Impact Levers To Boost CLV
Retention forms the bedrock of any CLV strategy. Personalization brings relevance to each interaction. Segmentation channels your resources where they matter most.
-
Elevate Loyalty And Feedback
Enhance your rewards program, add tiered incentives, and invite honest input at key touchpoints. -
Trigger Predictive AI Journeys
Set up email and SMS workflows that fire based on behavior patterns and lifecycle benchmarks. -
Laser-Focus On High-Value Groups
Identify top-tier customers, craft exclusive offers, and allocate budget to the segments driving the biggest returns.
Key Drivers Of Customer Lifetime Value
Below is a snapshot of these methods, the benefits they deliver, and the expected lift in CLV.
| Method | Benefit | Estimated CLV Increase |
|---|---|---|
| Refine Retention Strategies | Strengthens loyalty and cuts churn | 25–35% |
| AI-Driven Personalization | Crafts one-to-one experiences at scale | 20–30% |
| Precision Segmentation | Targets offers to your top cohorts | 15–25% |
This table translates into real results. The subscription box example reworked its loyalty tiers and saw repeat rates climb 30%. Meanwhile, the SaaS team layered in predictive scoring to deliver tailored emails, sparking a 22% CLV boost.
Quick Win Checklist
- Map every customer touchpoint and pinpoint where churn spikes. Tweak your loyalty rewards right away to plug those leaks.
- Integrate AI triggers in your CRM—think purchase anniversaries or product usage milestones—to fire personalized offers.
- Analyze segment performance weekly. Double down on the cohorts generating the strongest revenue.
Start by reinforcing retention—it’s the fastest path to higher CLV.
Download the CLV Spreadsheet Template or contact us for a tailored CLV diagnosis. Each tactic translates smoothly across B2B and manufacturing sectors—and sets the stage for more detailed strategies in the sections ahead.
Understanding Customer Lifetime Value
Customer Lifetime Value (CLV) measures the total revenue a customer brings in throughout your relationship. It goes beyond one-off purchases and helps you see if you’re truly covering acquisition costs while building a profit engine.
When you fixate on single transactions, it’s easy to miss the bigger picture—ongoing loyalty, repeat purchases, referrals. CLV flips that tunnel vision, pushing you to nurture customers instead of chasing every new lead.
Defining CLV And Common Myths
Imagine a large retail chain diving into its order data. At first glance, their biggest spenders looked rock-solid—until those customers vanished after six months. It turns out, average order value alone didn’t keep them around.
That story busts the myth that big shopping carts equal lasting loyalty. CLV factors in:
- Purchase frequency
- Customer lifespan
Here’s what trips people up:
| Misconception | Reality |
|---|---|
| Average order value captures loyalty | Frequency and tenure matter more |
| All customer cohorts contribute equally | The top 20% often deliver 80% of profits |
Most folks think CLV is a plug-and-play formula. In reality, it’s a balancing act—you may spend more on loyalty programs today, knowing payback comes later.
Questions To Ask Yourself
- Which customer segment drives 80% of profit over time?
- How long does each cohort stick around after their first purchase?
- What’s your CLV to Customer Acquisition Cost (CAC) ratio?
- At which stage do most customers drop out of your funnel?
Answering these will point you toward the highest-impact areas for budget and effort.
A 5% lift in retention often delivers up to 95% more profit by extending customer lifespans.
CLV Within Your Marketing System
CLV shouldn’t live in isolation. It guides every marketing touchpoint—from the first ad click to loyalty rewards. Here’s how it fits in:
| Component | Role in CLV Analysis |
|---|---|
| Acquisition Channels | Measure CAC and vet initial customer quality |
| Behavioral Segmentation | Spot trends that predict future spending |
| Retention Programs | Craft incentives to boost repurchase frequency |
| Automated Journeys | Trigger cross-sells or renewals at just the right time |
Striking the right balance between acquisition spend and retention tactics ensures you’re fueling sustainable growth, not just quick wins.
Balancing Acquisition And Loyalty
Finding that sweet spot between bringing in new clients and keeping existing ones can feel like walking a tightrope. Take a B2B manufacturer that shifted 15% of its ad budget into a reactivation email campaign. Within four months, CLV jumped 12% and CAC held steady.
Key takeaways:
- Test budget tweaks on small segments before full rollout
- Track churn and reactivation metrics weekly
- Be cautious with discounting—it can erode margins fast
These moves underscore why CLV is more than a fancy metric. It’s the lever that turns marketing from an expense into a profit driver.
Key Metrics To Watch
Keep these KPIs front and center in your dashboard—your CLV strategy depends on them:
- Churn Rate by segment
- Repurchase Cadence or average time between orders
- CLV:CAC Ratio
Automate these reports in your CRM or via GoHighLevel to catch trends early and pivot before small issues become big problems.
Calculating Customer Lifetime Value
When you set out to boost customer lifetime value, the first step is always measurement. Without data, you’re flying blind.
CLV rests on three core drivers: average order value, purchase frequency, and customer lifespan.
- Average Order Value captures how much each sale is worth
- Purchase Frequency reveals how often buyers return
- Customer Lifespan estimates how many years someone stays active
Once you have these figures, you can pinpoint which lever to push for the greatest impact.
Breakdown Of CLV Formula
Average Order Value is total revenue divided by the number of orders. Purchase Frequency measures how many times a customer buys in a given period. Customer Lifespan predicts the total years someone sticks around.
In practice, slot your numbers into the table below to see each component in action:
CLV Calculation Breakdown
| Variable | Description | Example Value |
|---|---|---|
| Average Order Value | Mean revenue per purchase | $50 |
| Purchase Frequency | Average purchases per year | 2 |
| Customer Lifespan | Active years per customer | 3 |
By lining these values up, you get a crystal-clear view of where to push for gains.
DTC Apparel Brand Example
Imagine a direct-to-consumer apparel label starting at an $50 average order value. Their buyers placed two orders per year and stayed engaged for three years.
That baseline produces a $300 CLV (50 × 2 × 3).
- A 10% jump in AOV lifts CLV to $330
- A 10% uptick in frequency also reaches $330
- Extending lifespan by 10% lands you at $330
Each tweak delivers roughly a 10% boost.
That diagram shows how AOV, frequency, and lifespan feed directly into total CLV.
Common Pitfalls And Benchmarks
It’s easy to conflate median and mean and understate your true CLV. A $48 median order size may look solid, but if the mean is $50, you’re leaving revenue on the table.
Apparel brands typically see CLV between $150 and $400. To keep your math honest:
- Track both median and mean to spot divergence
- Exclude one-off outliers that inflate averages
- Adjust for seasonality and product launches
Regularly checking each CLV component shines a light on the right growth levers and keeps reporting unbiased.
Using The Spreadsheet Template
We designed a spreadsheet with cohort tabs so you can drop in your raw data. AOV, frequency, and lifespan update automatically, and charts shift as you adjust assumptions.
CLV = AVERAGE(OrderValue) * Frequency * Lifespan
Customize fields for different pricing tiers or service bundles. Sharing this live document with finance and marketing keeps everyone aligned on targets and progress.
Setting Realistic Goals
Don’t guess—benchmark against similar players in manufacturing and B2B. Industry reports and association data will help you define realistic ranges.
Aim for at least a 3:1 CLV to CAC ratio. If you’re at 2:1, zero in on retention or increasing spend per visit.
- Identify top-performing segments and their CLV:CAC ratios
- Model incremental gains from specific initiatives
- Align cross-functional teams around quarterly objectives
Next Steps
Download the CLV Spreadsheet Template to kick off your analysis.
- Plug in your historical data
- Scan cohort charts for churn signals
- Tweak one metric at a time and observe the ripple effect
- Present insights to leadership and secure buy-in
Calculating and monitoring CLV this precisely gives you an engineer’s view of revenue drivers—so you can grow customer lifetime value in every corner of your business. Our template comes preloaded with example formulas and benchmarks, ready for action today.
Boost Retention With Loyalty And Pricing
Retention offers a quick path to lifting customer lifetime value—when your program clicks, buyers keep coming back.
One online retailer matched reward tiers to its profit margins and saw repeat purchases climb by 25% in just six months. It’s a clear signal: the right incentives work.
How Loyalty Programs Align With Profit
Effective reward structures start with spending milestones that make sense for both your business and your customers.
- Set tier triggers at realistic levels: for instance, $300 in total spend could unlock free samples.
- Control costs by limiting free items or discounts tied to each level.
- Avoid runaway expenses by capping rewards as a share of lifetime spending rather than per order.
Just a 5% boost in retention can translate into 25–95% higher profits. Brands running solid loyalty schemes often push retention up to 85%, and tailored messaging can increase repeat buys by 20–30%. Read the full research on Shopify
“Tying perks to clear spending goals lifts repeat business without eating into margins,” says Karl, founder of Machine Marketing.
Personalized Offers To Reengage Dormant Buyers
Waking up inactive customers brings hidden revenue back to light. The secret lies in timing and relevance.
- Target folks who haven’t bought in the last 90 days.
- Match offers to their purchase history—think custom bundles or tiered discounts.
- Roll out an automated email/SMS series in GoHighLevel around birthdays or anniversaries.
In one B2B parts case, this lifted reactivation by 18%. Keep an eye on redemption: if it dips below 2%, pause campaigns and refine rather than deepening discounts that hurt your bottom line.
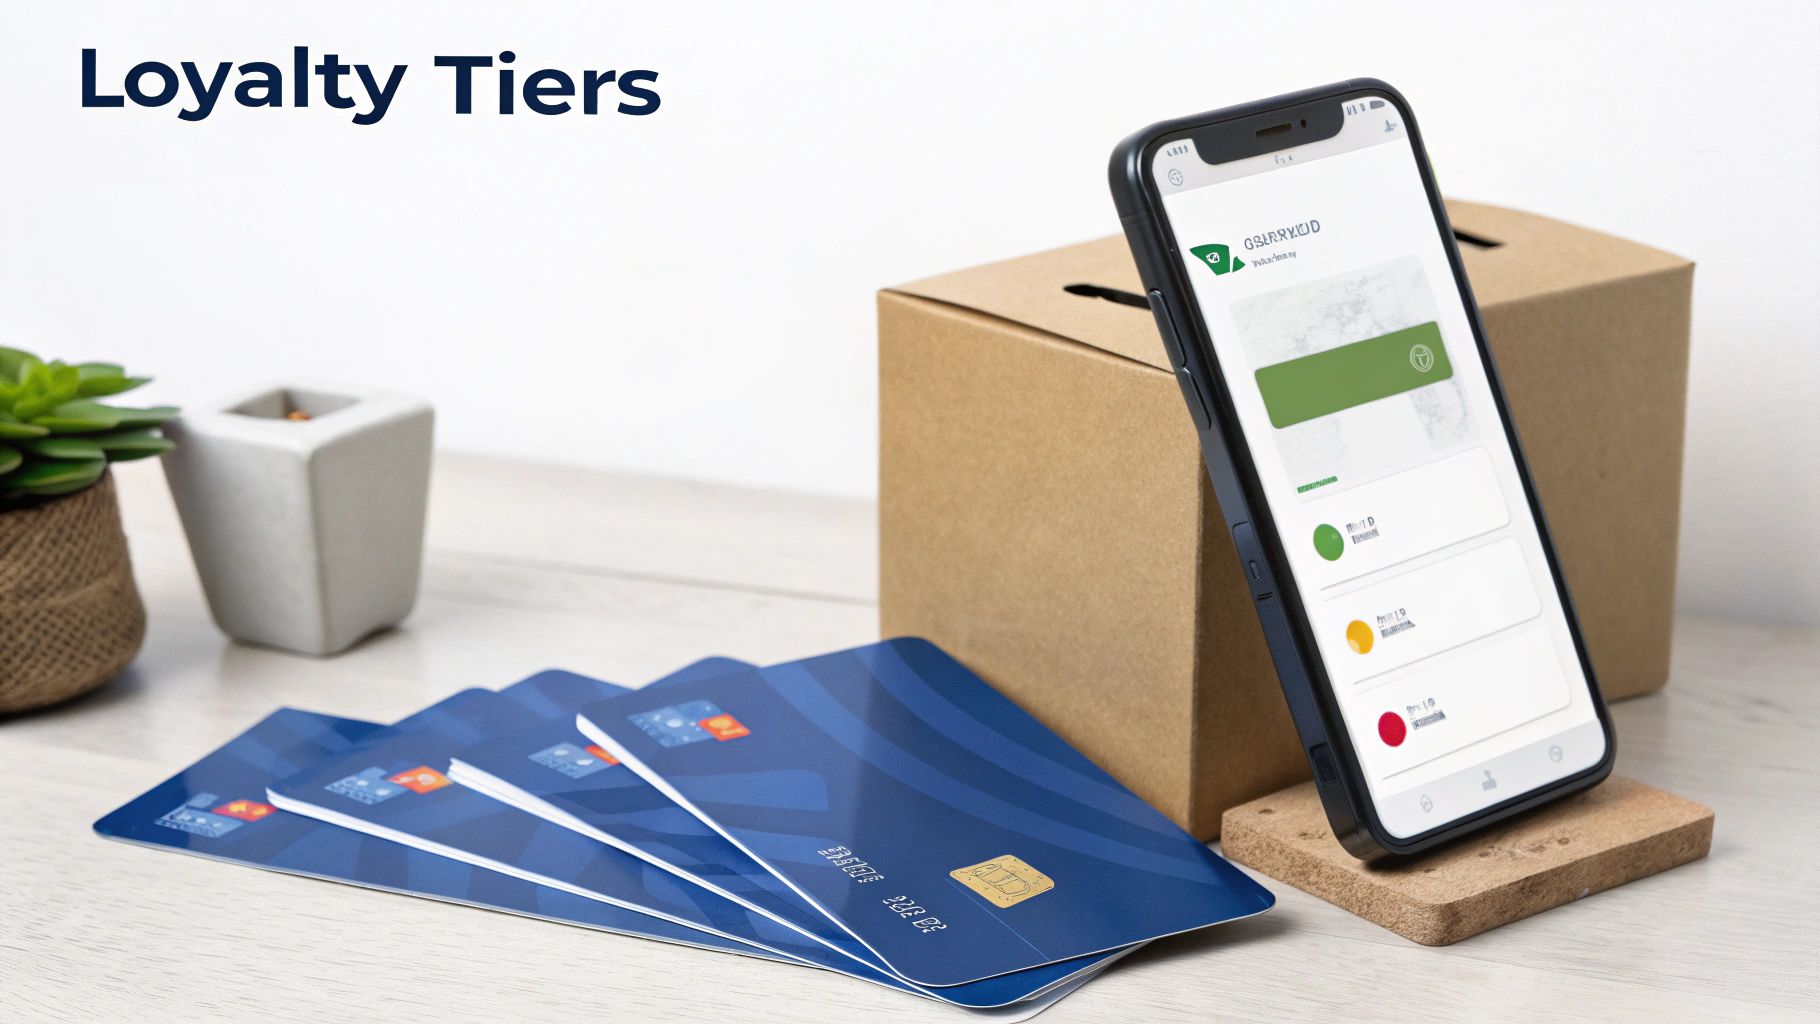
Tiered Pricing Models That Drive Loyalty
Layered pricing rewards eager buyers and protects your margins. Here’s a simple three-tier framework:
| Tier | Spend Range | Perks |
|---|---|---|
| Bronze | $0–$199 | Free shipping on orders over $50 |
| Silver | $200–$499 | 5% discount and early access |
| Gold | $500 and above | 10% discount and VIP support |
This approach nudges customers toward higher levels, where perks align with your margin buffer.
Tracking in your CRM shows which tiers drive the best profit lift. Then adjust thresholds based on your average order value and buying frequency.
Check out our guide on database-driven email marketing automation for more on setting up these sequences in your CRM: database-driven email marketing automation.
Key Metrics To Track Loyalty Impact
- Redemption Rate: how many customers redeem rewards and move up tiers
- Average Order Value Lift: compare AOV before and after the program
- Margin Contribution: net profit per tier after reward costs
Review these numbers each month to catch underperforming tiers before they drain profits.
Use these loyalty and pricing strategies to boost customer lifetime value. Start defining tiers, tracking expense, and rolling out targeted incentives this quarter. Continuously test each reward segment, then measure success quickly.
Use AI Personalization For Marketing Automation
Turning broad outreach into one-to-one conversations is the power of AI personalization. It tweaks everything—from subject lines to send times—based on real customer behavior. This shift in relevance is a proven lever for boosting customer lifetime value.
In the sections below, we’ll walk you through choosing predictive models, connecting them to your CRM, and firing up live email and SMS triggers. When data-driven segments kick in, every message lands at just the right moment.
Before diving in, make your AI engine choice around three core criteria: data volume, model accuracy, and ease of integration. Platforms with prebuilt connectors and clear documentation save you weeks of custom development. Steer clear of systems that demand heavy coding.
Selecting Predictive Tools
Predictive models score customers on churn risk, upsell potential, or lifetime value. Integrate these insights into GoHighLevel or your CRM to target your highest-value segments.
- Zapier Connectors: Plug-and-play links to tools and native API access
- Automated Retraining: Dashboards that flag performance dips and trigger model updates
- Compliance Modules: Built-in support for GDPR, CCPA, and other privacy rules
Run a small pilot, compare precision and recall metrics, then pick the model that fits your data and team workflow. This hands-on approach minimizes surprise roadblocks later.
Integrating With Your CRM
A seamless sync turns your CRM into a live map of customer intent. APIs or webhooks keep every score update in step with contact records.
- Real-time field updates that reflect changing churn risk
- Workflow triggers that launch sequences in GoHighLevel or your CRM when thresholds are crossed
- Field mapping strategies for recency, frequency, and monetary value
One manufacturing partner we worked with linked predictive scores to GoHighLevel and watched repeat purchases climb by 40%. After each buying milestone, they automatically sent tailored product recommendations.
“Hyper-targeted sequences drove a 40% lift in repurchase rates for our B2B client,” says Karl, Founder of Machine Marketing.
Deploying Advanced Chatbots And Recommendations
Chatbots give you round-the-clock engagement, handling standard questions and handing off complex issues to live agents. Meanwhile, recommendation engines suggest add-ons and service renewals right in the chat.
- Auto-responses for common FAQs to free up your support team
- Escalation rules that route complex tickets based on sentiment analysis
- Dynamic product bundles suggested from past orders and usage patterns
These intelligent assistants recover abandoned carts and ping renewal reminders. When bots speak from a customer’s own history, they feel informed and timely.
Maintaining Data Quality
Your personalization is only as good as the data you feed it. Cleaning duplicates and standardizing inputs before training keeps your model precise.
- Quarterly data audits to check for gaps and errors
- Entry-point validation rules that enforce consistent formats
- Drift monitoring to compare model predictions against real outcomes
Empower data stewards in your SOPs and train every user on hygiene best practices. This prevents segmentation slip-ups that can erode your CLV gains.
Companies using AI personalization report up to 71% CLV growth, and analysts predict 85% of firms will adopt predictive modeling by 2025. That shift can drive 91% higher retention through omnichannel outreach. Discover more insights about AI-driven CLV growth
For a deeper dive into automating B2B workflows, explore our guide on Business To Business Marketing Automation.
- Tie personalization metrics directly to KPIs like repeat purchase rate
- Schedule weekly model retraining and data reviews to avoid drift
- Track open rates, click-throughs, and churn indicators to sharpen each journey
AI-driven personalization isn’t a one-and-done project—it’s a cycle of test, learn, and refine. Start with a small use case, measure impact, and scale rapidly. You’ll begin to see CLV climb as each sequence evolves.
Measuring Success And Key Metrics

Building a live dashboard is the quickest way to see if your customer lifetime value (CLV) work is paying off. By watching core KPIs—CLV:CAC ratio, churn rate, and repeat purchase rate—you catch both big wins and small leaks in real time.
In one recent project with a B2B manufacturer, spotting a slight churn uptick let us jump in before revenue slipped. You can automate these stats in GoHighLevel or your CRM of choice, complete with custom fields and workflows that refresh daily.
You might be interested in our guide on marketing analytics to deepen your reporting skills: Learn more about marketing analytics in our guide
Essential Metrics To Track
A handful of indicators will tell most of the story:
-
CLV:CAC Ratio
Total customer value divided by acquisition cost. Healthy programs hit 3:1 or better. -
Churn Rate
Percentage of customers lost over a period. Under 10% annually keeps you in the safe zone. -
Repeat Purchase Rate
Share of customers who buy more than once. Top performers clear 40%.
“You can’t improve what you don’t measure,” says Karl, Founder of Machine Marketing.
Benchmark Metrics For CLV Programs
Before you set targets, compare your numbers to industry norms. This table helps you gauge where you stand and where to push next.
| Metric | Description | Benchmark |
|---|---|---|
| CLV:CAC Ratio | Customer lifetime value divided by acquisition cost | 3 to 5 |
| Churn Rate | Percent of customers lost in a period | 5% to 10% |
| Repeat Purchase Rate | Fraction of customers with multiple purchases | 35% to 50% |
Putting your data side by side with these ranges makes goal-setting a lot less guesswork.
Setting Achievable Targets
Start with last quarter’s figures and build from there.
- Establish a baseline for each metric.
- Aim to reduce churn by 1% each quarter.
- Track progress in your dashboard, updating weekly.
Goals that are Specific, Measurable, Attainable, Relevant, and Time-bound keep teams focused. Automate alerts so you know the moment a KPI slips below your threshold.
Monitoring Tools And Alerts
Use your CRM’s dashboard features to spotlight anomalies. Set threshold-based triggers and get email or Slack notifications for churn spikes or dips in repeat purchases.
Then review alerts first thing each morning. GoHighLevel lets you slice reports by region, product line, or campaign source—perfect for quick check-ins or executive snapshots.
Segmenting For High Impact
Splitting data into cohorts uncovers hidden opportunities:
- Industry verticals often show unique churn patterns.
- Billing tiers can correlate with different repeat rates.
- Acquisition channels influence both CAC and CLV.
A segmented dashboard in GoHighLevel makes filtering and side-by-side comparisons effortless. Find high-value pockets that deserve extra attention and resources.
When To Pivot Strategy
Keep an eye out for sustained drops in repeat purchase rate or spikes in churn. If your CLV:CAC falls below 2:1 for more than two reporting cycles, it’s time to course-correct.
Possible pivots include:
- Shifting ad spend from acquisition to retention campaigns.
- Launching targeted email or SMS reactivation flows.
- Tweaking loyalty perks to boost engagement.
Timely pivots can salvage a campaign before costs spiral out of control.
Dashboard Templates And Next Steps
We’ve built drop-in templates with all key KPIs and segment filters ready to go. Plug in your data, adjust target thresholds, and share with stakeholders in minutes.
Hold a weekly data review to spot trends, decide on pivots, and keep everyone aligned. This iterative cycle is the backbone of sustained CLV growth.
Frequently Asked Questions
What’s the best tool for small businesses to automate retention?
When I work with lean teams, they often turn to GoHighLevel because it brings email, SMS and CRM into a single dashboard. The visual workflow builder makes it painless to slice audiences and fire off trigger-based messages. Plus, the built-in reports highlight retention trends in real time. This all-in-one setup saves you from juggling subscriptions and wrestling data silos.
Tools For Automating Retention
- GoHighLevel: Built-in campaign triggers and reporting
- Mailchimp: Budget-friendly templating and simple automations
- ActiveCampaign: Deep segmentation with predictive send times
- Zapier integrations to tie CRM data to purchases and invoices
How do you balance acquisition spend with retention investments?
I always start by calculating the CLV:CAC ratio to see how long it takes to recoup ad dollars. When that ratio sits below 3:1, you should nudge a slice of your budget toward retention. I recommend running a small-scale test first—watch churn rates and repeat purchase stats before rolling it out more broadly.
Balancing Acquisition And Retention
- Review last quarter’s retention lift against your ad spend
- Set a maximum CAC threshold to trigger any budget shifts
- Reserve at least 20% of marketing dollars for loyalty and repeat-sale programs
What common pitfalls should you avoid when launching loyalty programs?
I’ve seen companies promise lavish rewards without modeling margins—and it backfires fast. Overly complex tiers can confuse members and kill momentum. And generic perks rarely impress your top customers.
Misaligned incentives erode profitability faster than they boost loyalty.
Loyalty Program Pitfalls
| Pitfall | How To Fix |
|---|---|
| Over-generous rewards | Model net margin before launch |
| Confusing tier rules | Keep levels simple and transparent |
| One-size-fits-all perks | Tailor perks to high-value customer needs |
How can you accurately measure ROI on personalization campaigns?
Link every automation metric back to revenue in your CRM, and run A/B tests on segments with and without personalization. Then use this formula:
(Incremental Revenue − Campaign Cost) ÷ Campaign Cost. A disciplined approach makes it easy to trust your numbers and keep improving.
Measuring ROI On Personalization
- Define a control group of similar size and behavior
- Track metrics like click-through rate and average order value lift
- Use fixed windows (30 or 90 days) to capture long-term effects
- Compare cohort performance to isolate your strategy’s impact
What else deserves clarity when boosting CLV?
Gather customer feedback at every stage to sharpen your rewards and messaging. Routine data audits keep your segments accurate and your personalization on point. I also run weekly KPI reviews and set early-warning signals so small leaks don’t turn into big problems.
Workflow Review Schedule
How Often Should I Update Retention Workflows?
I aim to audit automated sequences quarterly to ensure they stay fresh.
- Check engagement rates and refine triggers based on real data
- Refresh messaging snippets to reflect new promotions or recent feedback
Final Tips
- Set up real-time alerts for any sudden churn spikes
- Hold a cross-department review every month
- Build concise dashboards to share insights with your team
To recap: Focus on retention, personalization, and data-driven segmentation to lift CLV. Start by mapping your customer journeys, testing one lever at a time, and automating your dashboards. The next step is to Download the CLV Spreadsheet Template and book a discovery call with Machine Marketing for a tailored plan.
Ready to scale your CLV growth? Book a discovery call with Machine Marketing.