
If you’re pouring money into marketing but can’t point to exactly how it’s making you money, you have a diagnosis problem. This is where marketing analytics comes in. It’s the system for measuring, managing, and analyzing your marketing performance to figure out what’s working, what isn’t, and how to get the best possible return on investment (ROI).
Your Marketing Is Creating Data. Are You Using It?
Think of your business as an engine. Marketing analytics is the control panel. It shows you which levers to pull, which dials to turn, and which systems need a tune-up. Instead of guessing what your customers want, you'll know precisely how to attract more qualified leads and close more deals. For B2B and manufacturing businesses, this isn't a "nice-to-have"; it's your diagnostic tool for sustainable growth.

The biggest hurdle for most business owners isn’t a lack of data. It’s the lack of a clear system to turn raw information into actionable answers. Every website visit, email open, and ad click is a piece of evidence. The real challenge is connecting the dots to see what actually drives your business forward.
The Shift From Guesswork To A Data-Driven System
Without a structured way to look at your data, marketing decisions are based on gut feelings. Implementing an analytics framework changes everything. It shifts your entire operation from being reactive to proactive, letting you diagnose problems and build solutions based on hard evidence. To do this, you have to understand What exactly is Marketing Analytics and its core concepts.
Let’s diagnose the difference. It’s the difference between flying blind and flying with a full instrument panel.
| Marketing Approach | Without Analytics (Guesswork) | With Analytics (Diagnosis & Solution) |
|---|---|---|
| Strategy | "Let's try this and see what happens." | "The data shows our top leads come from this channel. Let's double down." |
| Budgeting | Spending based on intuition or past habits. | Allocating budget to campaigns with the highest proven ROI. |
| Lead Quality | All leads are treated equally. | Focusing sales efforts on leads that show high-intent signals. |
| Reporting | "Our website traffic is up this month." | "Traffic from our new blog post generated 15 qualified leads." |
The goal is to move from making assumptions to making informed, strategic decisions that directly impact your bottom line.
Key Insight: Moving from guesswork to a data-driven system means you stop asking, "What should we do next?" and start asking, "What does the data tell us is the highest-impact action to take right now?"
The challenge of data overload is real. Marketers are now wrangling 230% more data per query than they were in 2020. Yet, the same roadblocks persist. A staggering 56% of marketers say they don’t have enough time for proper analysis, while 38% admit they don’t have the right tools to connect everything.
This is exactly why you need a system—not just more numbers. You need a framework that turns a mountain of raw data into a clear, actionable strategy.
Focusing On The Metrics That Actually Matter
It’s easy to get lost in a sea of data. Business owners today have access to hundreds of potential metrics, but most of them are noise. To get actionable insights, you need to ignore the clutter and focus on the vital signs of your marketing's financial health—the key performance indicators (KPIs) that connect directly to your bottom line.
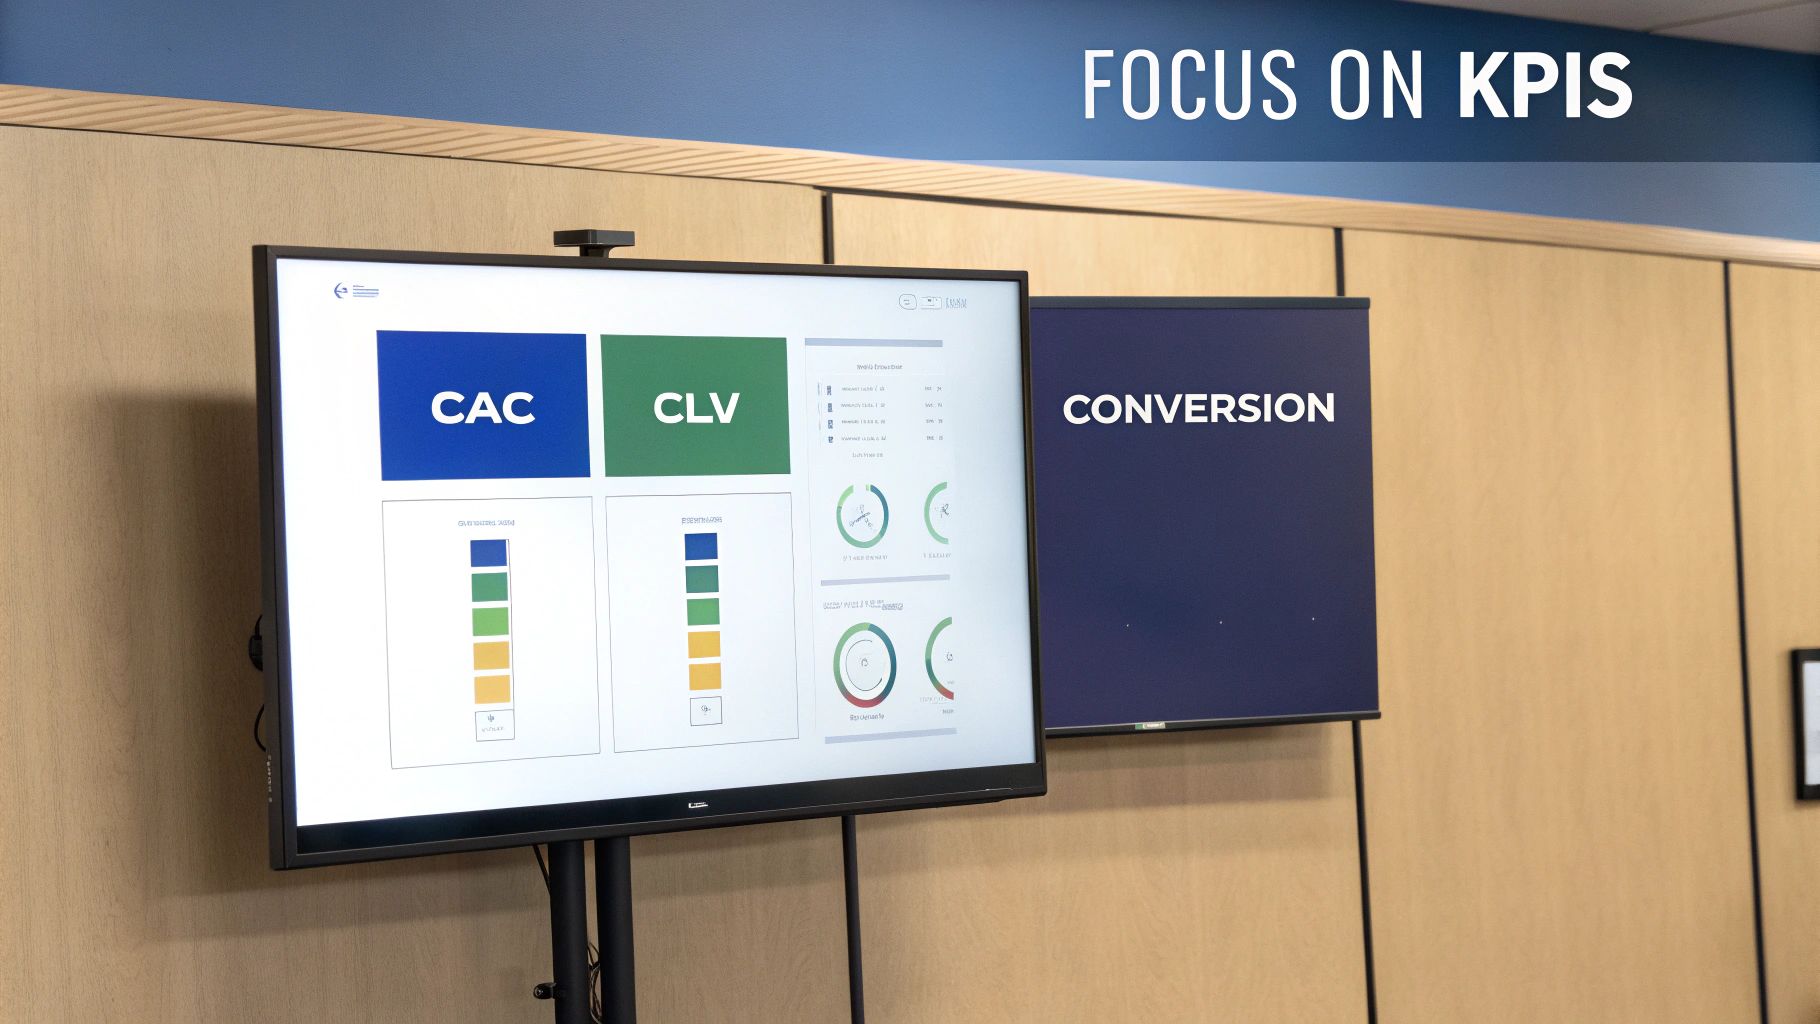
Instead of tracking every click and impression, we recommend focusing on three core metrics. Think of these as the only numbers you'd need if you were stranded on a desert island and still had to run your business. They create a clean, powerful dashboard for making informed decisions.
Customer Acquisition Cost (CAC)
Your Customer Acquisition Cost (CAC) tells you exactly how much you're spending to win a new customer. It's the ultimate report card for your marketing and sales efficiency. A low CAC is a sign of profitable growth; a high CAC is an alarm that your spending is out of control.
- How to Calculate It: (Total Marketing & Sales Spend) / (Number of New Customers Acquired)
- What It Diagnoses: This metric answers the question, "Is our growth engine efficient, or are we just burning cash?" It helps you determine if your marketing budget is a smart investment.
For example, a B2B manufacturer spends $10,000 on a trade show and acquires 5 new clients. Their CAC for that event is $2,000 per client. Knowing this number lets them compare it to other channels, like a digital ad campaign with a CAC of only $800.
Customer Lifetime Value (CLV)
While CAC looks at the upfront cost, Customer Lifetime Value (CLV) reveals the total revenue you can expect from a single customer over their entire relationship with you. This is the key to understanding long-term profitability and justifying your acquisition spend.
- How to Calculate It: (Average Purchase Value) x (Average Purchase Frequency) x (Average Customer Lifespan)
- What It Diagnoses: CLV answers the big question: "What is a new customer actually worth to us over time?" It forces you to think beyond the first sale and focus on building lasting, profitable relationships.
If that same manufacturer’s average client spends $5,000 per year and stays for 4 years, their CLV is $20,000. Suddenly, the $2,000 CAC from the trade show looks like a brilliant investment.
The Golden Ratio: A healthy business typically has a CLV that is at least 3x its CAC. A 3:1 ratio is a solid benchmark—it means for every dollar you spend to get a customer, you get three dollars back over their lifetime.
Conversion Rate
Your Conversion Rate is the percentage of people who take a specific action you want them to take, like filling out a quote request form. It’s a direct measure of how persuasive your marketing is. Understanding this is fundamental to learning how to measure marketing ROI.
- How to Calculate It: (Number of Conversions / Total Visitors) x 100
- What It Diagnoses: This metric is a diagnostic tool for finding friction in your sales process. A low conversion rate signals that something is broken—your messaging, your offer, or your website's user experience.
These three metrics are powerful tools for growth. By focusing on them, you stop collecting data for its own sake and start translating data into a strategic imperative that drives your business forward.
Unifying Your Data To See The Full Picture
Your most valuable insights are likely trapped in disconnected systems. Website traffic lives in Google Analytics, lead data is in your CRM, and social media engagement is on another platform entirely. This fragmentation makes it impossible to see how your marketing efforts actually translate into sales.

The real goal of marketing analytics is to create a single, cohesive view of the entire customer journey. Instead of looking at isolated snapshots, you can trace the complete path a lead takes—from a LinkedIn ad click, to a specific product page visit, to an email nurture sequence.
This unified view is where you find the most valuable insights. It's how you discover that your most profitable customers all watched the same demo video. Without connecting these dots, you're just staring at pieces of a puzzle.
Building Your Integrated Analytics Engine
Creating this unified view requires a deliberate approach. It’s about choosing the right tools and ensuring they communicate. Your marketing technology stack is the foundation for this system, acting as the central nervous system for all your data. A well-designed stack ensures information flows seamlessly between platforms.
Here are the essential data sources you need to connect:
- Website Analytics: Tools like Google Analytics provide raw data on user behavior—what pages they visit, how long they stay, and where they came from.
- Customer Relationship Management (CRM): Your CRM (like GoHighLevel) holds your sales data. It tracks leads, deals, and customer interactions, showing you who converts and what their journey looked like.
- Advertising Platforms: Data from Google Ads and LinkedIn Ads reveals which campaigns drive traffic and, more importantly, which ones lead to sales.
- Email Marketing Systems: This source shows who is engaging with your messages, clicking through to your site, and moving down the sales funnel.
Key Takeaway: True marketing analytics isn't about having more dashboards; it's about having one dashboard that tells the whole story. Unifying your data is the only way to accurately attribute revenue to specific marketing activities.
The push for this integrated approach is growing stronger. Real-time analytics is changing the game, allowing for instant campaign adjustments. With digital transformation spending projected to hit $3.9 trillion by 2027, a solid analytics infrastructure is no longer an advantage—it's a necessity. This is especially true in B2B, where 83% of sales teams using AI for real-time insights report revenue growth.
How A Manufacturer Put Analytics Into Action: A Case Study
Theory is one thing; results are what matter. Let's look at a real-world example of a B2B manufacturer stuck with an unpredictable, feast-or-famine lead flow. They knew something was wrong but couldn't diagnose the problem, making a reliable growth system impossible to build.
This is a classic case where marketing analytics becomes the primary diagnostic tool. By integrating their website data with their CRM, we could finally see what was really happening under the hood.
Diagnosis: Identifying The Root Problem
Instead of guessing, we let the unified data tell the story. The analysis quickly pinpointed two major bottlenecks that were strangling their lead generation.
The data revealed two specific issues:
- Low Organic Visibility: When potential customers searched for high-value terms related to their custom fabrication services, they were invisible. All that high-intent traffic was going straight to their competitors.
- High Form Abandonment: This was the critical failure point. We found a massive drop-off on their "Request a Quote" form. Using session recordings, we watched users get frustrated with a form that was too long and confusing. The result? Over 60% of motivated prospects gave up and left.
Key Insight: Without analytics, the manufacturer's first instinct might have been to pour thousands into ads. But that would have been like trying to fill a leaky bucket. The data showed us the actual holes that needed patching first.
Solution: Implementing A Data-Driven Fix
Once we had a clear diagnosis, the path forward was obvious. We didn't need to rebuild their entire marketing strategy. We needed a targeted, two-pronged solution aimed directly at the identified weaknesses.
First, we rolled out a focused SEO strategy to improve their rankings for critical service-related keywords. Simultaneously, we completely streamlined the quote request form, slashing the number of fields and clarifying the process. This systematic, data-informed approach began the transformation of their marketing from a cost center into a reliable source of measurable ROI.
Using AI And Automation As Your Analytics Superpower
Manually sifting through spreadsheets is no longer a viable growth strategy. To make smarter decisions faster, you need a force multiplier. This is where artificial intelligence (AI) and automation transform complex analytics from an overwhelming chore into a powerful tool for any business.
AI acts as your expert data scientist, working 24/7. These systems analyze enormous datasets to uncover hidden patterns, predict customer behavior, and suggest campaign optimizations—tasks that would take a human analyst weeks.
Putting Your Data To Work Automatically
Automation is your execution team. It takes the insights AI uncovers and puts them into action without you lifting a finger. This is how you build a system that responds to customer behavior in real-time, creating a more personalized and effective experience.
Here’s how this works in practice:
- Automated Lead Tagging: Your CRM can automatically tag leads based on their website activity. For example, if someone views your pricing page three times, the system can flag them as a "high-intent" prospect for immediate sales follow-up.
- Triggered Follow-Ups: When a prospect downloads a case study, an automated email sequence can kick off to nurture that specific interest, delivering relevant information when they're most engaged.
- Automatic Reporting: Instead of spending hours building reports, key performance dashboards can be generated and sent straight to your inbox automatically.
For B2B operators, this kind of system is a game-changer. Our guide on business-to-business marketing automation breaks down how to build these systems step-by-step.
The Transformation: Moving from manual analysis to an AI-powered system means you stop spending time finding the data and start spending time acting on it. It’s the difference between navigating with a paper map and using a GPS that reroutes you around traffic in real-time.
This isn't a future trend; it’s happening now. AI integration is a powerhouse for modern analytics, with 63% of marketers already deploying generative AI. Automation is a core necessity, enabling businesses to process vast datasets with speed and accuracy. The global marketing analytics market is projected to jump from $6.2 billion in 2025 to $7.24 billion in 2026, driven by AI's ability to uncover insights faster than humans can. You can discover more insights about marketing statistics on Salesforce.com.
Your 90-Day Analytics Implementation Plan
Ready to stop guessing and start measuring? Building a marketing analytics system doesn't have to be a massive, six-month project. You can lay a powerful foundation for data-driven growth by breaking it down into a manageable 90-day sprint.
This is a proven, step-by-step system for busy owners who need results. We'll walk through three phases, each with a clear goal and a simple checklist.
Days 1-30: Setup and Integration
The first month is about laying the groundwork. Your goal is to connect your most critical data sources so they can talk to each other. This creates the central hub needed for a single, unified view of your marketing performance.
Your Month 1 Checklist:
- Install Google Analytics 4: Ensure GA4 is properly set up on your website. This is non-negotiable for tracking user behavior and conversions.
- Connect Your CRM: Integrate your website directly with your CRM (like GoHighLevel). This is the key to connecting website activity to actual leads and sales dollars.
- Set Up Key Conversion Goals: Define and configure the most important actions a user can take, such as form submissions, phone calls, or demo requests. If it means business, track it.
Days 31-60: Data Collection and Benchmarking
Now that your system is connected, month two is about patience. Let the data flow in without making any knee-jerk changes. This period is crucial for gathering enough clean information to establish a reliable performance baseline.
Why This Matters: You can't know if you're improving if you don't know where you started. This 30-day window gives you the clean data needed to create benchmarks for traffic, lead quality, and conversion rates.
Think of it as moving from manual effort to an automated, smarter system. The old way was pulling reports by hand; the new way is letting the system tell you what's working.
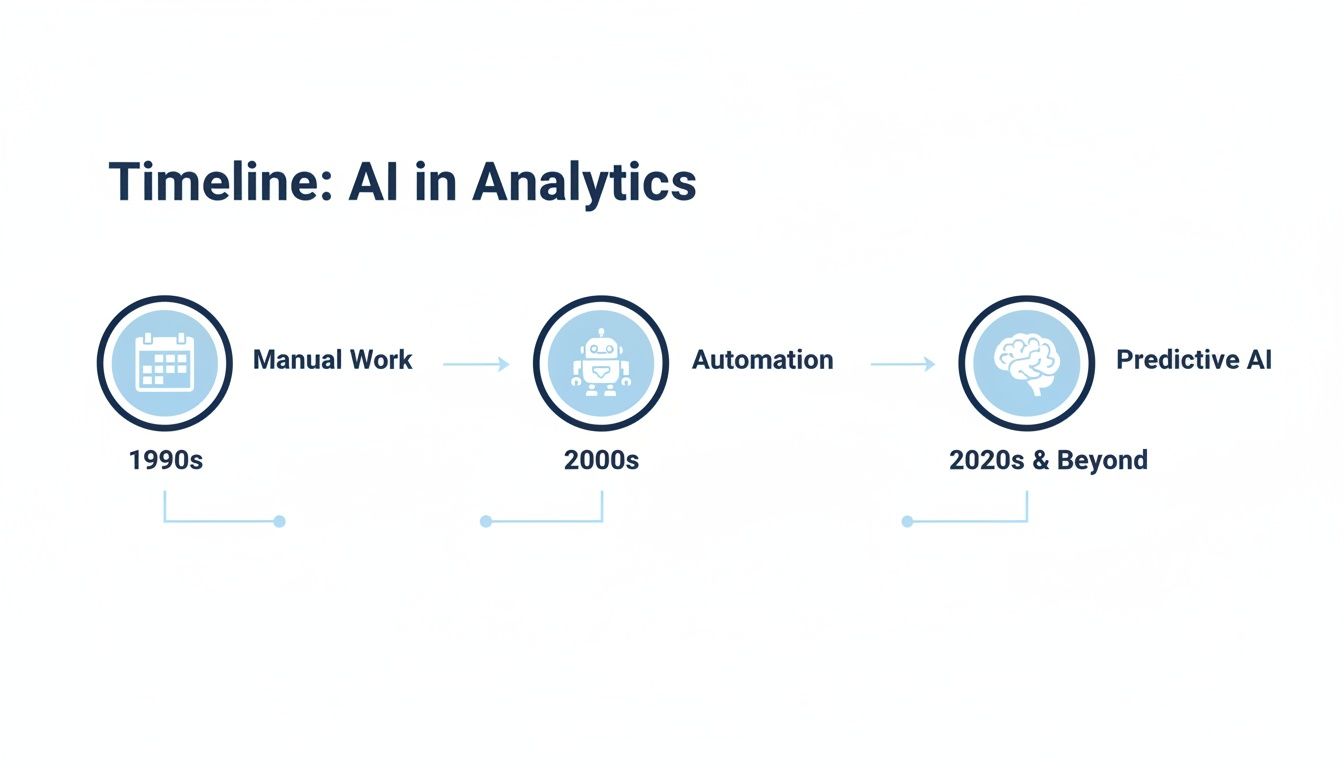
This visual shows that exact progression. You're building a system that moves your business toward automation and predictive insights—the natural next step for any business serious about using data.
Days 61-90: Analysis and Optimization
With a solid baseline established, it’s time to ask questions and make informed adjustments. Your goal in this final month is to analyze the data, identify one clear opportunity for improvement, and take targeted action.
Your Month 3 Checklist:
- Review Your Data: Look at your unified dashboard. Where are your best leads coming from? Where are people dropping off?
- Identify One Bottleneck: Don't try to fix everything. Find the single biggest point of friction in your customer's journey. Is it a confusing landing page or a low-converting form?
- Make One Targeted Change: Based on your analysis, make one specific, measurable change to address the bottleneck. Then, watch the data to see what happens.
Your 90-Day Analytics Implementation Roadmap
Here's the entire plan laid out as a step-by-step roadmap. Follow this, and in three months, you'll be making decisions based on facts, not feelings.
| Phase | Key Actions | Goal |
|---|---|---|
| Days 1-30 | 1. Install Google Analytics 4. 2. Connect website to CRM. 3. Define and track conversion goals. |
Establish a foundational data hub where all marketing activities can be tracked and connected. |
| Days 31-60 | 1. Let data accumulate without major changes. 2. Monitor dashboards. 3. Note initial patterns. |
Gather enough clean data to create a reliable performance baseline for future comparisons. |
| Days 61-90 | 1. Analyze data to find a key bottleneck. 2. Formulate a hypothesis. 3. Implement one targeted change. |
Move from data collection to data-driven action by making your first informed optimization. |
This 90-day plan is about building a repeatable system of diagnosis, action, and measurement that will drive consistent, predictable growth long after these first three months.
FAQ
You know you should be diving into your marketing data, but it's easy to get bogged down. We get it. Here are direct answers to the questions we hear most often.
How Soon Can I Expect To See Results?
You can start gathering useful data within the first 30 days of setup. Often, this initial data points to quick wins, like finding and fixing a broken contact form that was costing you leads.
However, the deep, strategic insights that create predictable growth begin to appear after about 60-90 days. That's when you have enough consistent data to establish reliable benchmarks and spot meaningful trends, not just daily fluctuations.
Do I Need To Be A Data Scientist To Use Marketing Analytics?
Absolutely not. Modern analytics tools are built for business leaders, not statisticians. The goal isn't to get lost in complex algorithms; it's to focus on a few key metrics that tie directly to your bottom line.
Our Approach: We start clients with the "big three" metrics: Customer Acquisition Cost (CAC), Customer Lifetime Value (CLV), and Conversion Rate. Mastering these will give you 80% of the insights you need with only 20% of the effort. The point is to use data to make better decisions, not to get buried in it.
What Is The Biggest Mistake To Avoid?
The single biggest mistake is "analysis paralysis"—collecting mountains of data but never actually doing anything with it. Information without action is a distraction.
Another common pitfall is chasing "vanity metrics" like social media likes or impressions. They feel good, but they don't pay the bills. Instead, track metrics tied directly to revenue, like qualified leads generated or sales closed.
Ask yourself this one question: "What decision will this data point help me make?" Start small, focus on what drives your business, and commit to making consistent improvements based on what the data tells you.
Ready to stop guessing and start building a predictable growth engine? Machine Marketing specializes in implementing data-driven marketing systems for B2B and manufacturing businesses. Book a discovery call to get your custom 90-day implementation plan.