
If you're running a manufacturing business and every week feels like triage, the pattern is familiar. Sales promises a ship date before production weighs the load. Quality finds a recurring defect that never quite gets fixed. Maintenance is chasing downtime while engineering is pushing a change order that disrupts the floor. You don't have a strategy problem as much as you have an execution problem.
That's where EOS traction for manufacturers becomes useful. Not as business-book theory, but as a system for turning a plant, a leadership team, and a sales function into one operating rhythm. EOS is used by more than 257,000 companies worldwide according to this EOS manufacturing discussion. In manufacturing, that matters because the framework centers on six components, including Process and Traction, which fit environments where standard work, quality control, and on-time delivery already determine whether the business wins or loses.
Table of Contents
- Is Your Manufacturing Business Running You?
- Laying the Groundwork with an Accountability Chart
- From Gut-Feel to Data with a Manufacturing Scorecard
- The 90-Day Rhythm of Rocks and Level 10 Meetings
- Solving Problems from the Shop Floor to Sales
- Conclusion Your First Step to Gaining Traction
Is Your Manufacturing Business Running You?
A lot of manufacturers look organized from the outside and chaotic from the inside. Orders are moving, trucks are leaving, and people are busy. But underneath that activity, leaders are often managing by interruption.
You see it in small but expensive ways. Supervisors solve the same staffing conflict every week. A planner works around bad data instead of fixing the source. Sales and operations keep arguing about priorities because no one has translated the company goal into shared rules.
That's why EOS traction for manufacturers works best when you treat it as an execution system, not a motivation system. It gives the business a common language for ownership, a weekly cadence for review, and a way to separate signal from noise. It also fits manufacturing better than many office-first management frameworks because plants already depend on documented process and repeatability.
Practical rule: If your leadership team needs a hero every week, you don't have traction. You have dependency.
The trap is thinking your main problem is effort. Usually it isn't. Your team may be working hard and still losing ground because accountability is vague, issues aren't solved at the root, and the floor runs on one cadence while the commercial team runs on another.
Manufacturers feel this mismatch sharply. Production tracks schedules by the hour. Quality tracks escapes and rework. Engineering works through revisions. Sales works opportunities across a longer cycle. If those rhythms never connect, the company becomes reactive even when good people are in place.
A solid EOS implementation starts by making responsibility visible. Then it makes performance visible. Then it forces the team to solve what's getting in the way.
Laying the Groundwork with an Accountability Chart
Monday at 8:15, a hot order is already off track. Sales promised an expedite. Purchasing is waiting on a drawing revision. Production says the schedule was full on Friday. Quality wants first-article approval before the job moves. Everyone has a reason. Nobody owns the result.
That is usually where EOS starts paying off for a manufacturer. Before scorecards, Rocks, or meeting cadence, the business needs clear ownership tied to the work that drives plant performance.

Why org charts fail on the plant floor
A traditional org chart shows who reports to whom. An Accountability Chart shows who owns an outcome, the function, and the decisions that come with it.
That distinction matters in manufacturing because results cross departments all day. On-time delivery touches quoting, order entry, planning, purchasing, scheduling, production, quality, shipping, and customer communication. If no single seat owns the result, the company falls into handoff management. Handoffs feel busy, but they rarely improve flow.
I see this most often in plants where leaders confuse involvement with ownership. The sales manager joins the production meeting. The plant manager weighs in on every customer issue. The owner approves schedule exceptions one by one. Problems still bounce because the seat accountability was never defined.
An Accountability Chart exposes that quickly. It also shows where one role has become a choke point. In smaller firms, the operations leader often carries production, planning, purchasing, maintenance, quality, safety, and CI. That may work for a while. It usually breaks when lead times stretch, machine uptime drops, or the sales team starts bringing in more custom work than the floor can absorb.
How to build a manufacturing accountability chart
Start with the functions your business must perform well every week, not with employee names or legacy titles. Build the chart around results the company has to produce reliably.
For a manufacturer, those functions usually include:
- Operations: throughput, schedule attainment, labor coordination, plant rhythm
- Quality: corrective action, containment, compliance, customer escapes, system discipline
- Supply chain or procurement: supplier follow-up, material availability, inventory accuracy, inbound risk
- Maintenance or reliability: preventive work, response time, asset uptime, repair priorities
- Engineering: revisions, process documentation, launch readiness, change control
- Sales and marketing: pipeline growth, quote turnaround, account development, demand visibility
- Finance and administration: cash control, reporting, HR support, policy discipline
That maintenance seat matters more than many leadership teams admit. If nobody owns reliability, production pays for it in missed schedules, overtime, and rushed changeovers. Teams that need a better handle on uptime and repair performance should align role ownership with these essential reliability metrics resources.
After functions are clear, define the seats inside them. A plant may need a Head of Operations, Production Manager, Quality Manager, Maintenance Lead, Supply Chain Manager, Engineering Manager, Sales Manager, and Customer Service Lead. One person can hold multiple seats in a smaller company. The rule is simple. Each seat needs clear outcomes and decision rights.
Use three tests:
- Can one person own the result? If not, split the seat or narrow the outcome.
- Can the team measure whether the seat is winning? If not, the role is still vague.
- Would a supervisor know exactly where to escalate a problem? If not, the chart is still muddy.
A good Accountability Chart is designed to reduce handoffs and clarify decision-making, rather than mirror political structures or legacy titles.
If your team struggles to connect company goals to functional ownership, this strategic objective template for operational planning can help turn broad goals into assigned outcomes.
Make the VTO useful on the floor
The V/TO matters here because the chart should reflect the business you are trying to build, not the habits you inherited. If the company says it wants profitable repeat work, but the structure rewards rush custom jobs and constant schedule exceptions, the chart and the strategy are fighting each other.
Manufacturers need the V/TO translated into operating choices. What type of work fits the equipment, margin profile, and commercial model? Which customers fit the plant's cadence? What work should be refused because it burns capacity without building the right book of business? Those are practical decisions, not branding language.
Good examples are specific. A shop might decide to win in repeat medium-volume work with short quote turnaround and strong delivery performance. That choice should show up in seat accountabilities. Sales owns quote discipline and target accounts. Operations owns schedule adherence and capacity visibility. Engineering owns revision control. Quality owns containment and corrective action speed. Customer service owns communication when orders move.
When the Accountability Chart and V/TO line up, trade-offs get easier. The company can say no to work that wrecks schedule stability, yes to accounts that fit available capacity, and assign each recurring issue to one owner instead of five participants. That is the point. EOS theory becomes useful when it connects to plant rhythm, service levels, and pipeline decisions people make every day.
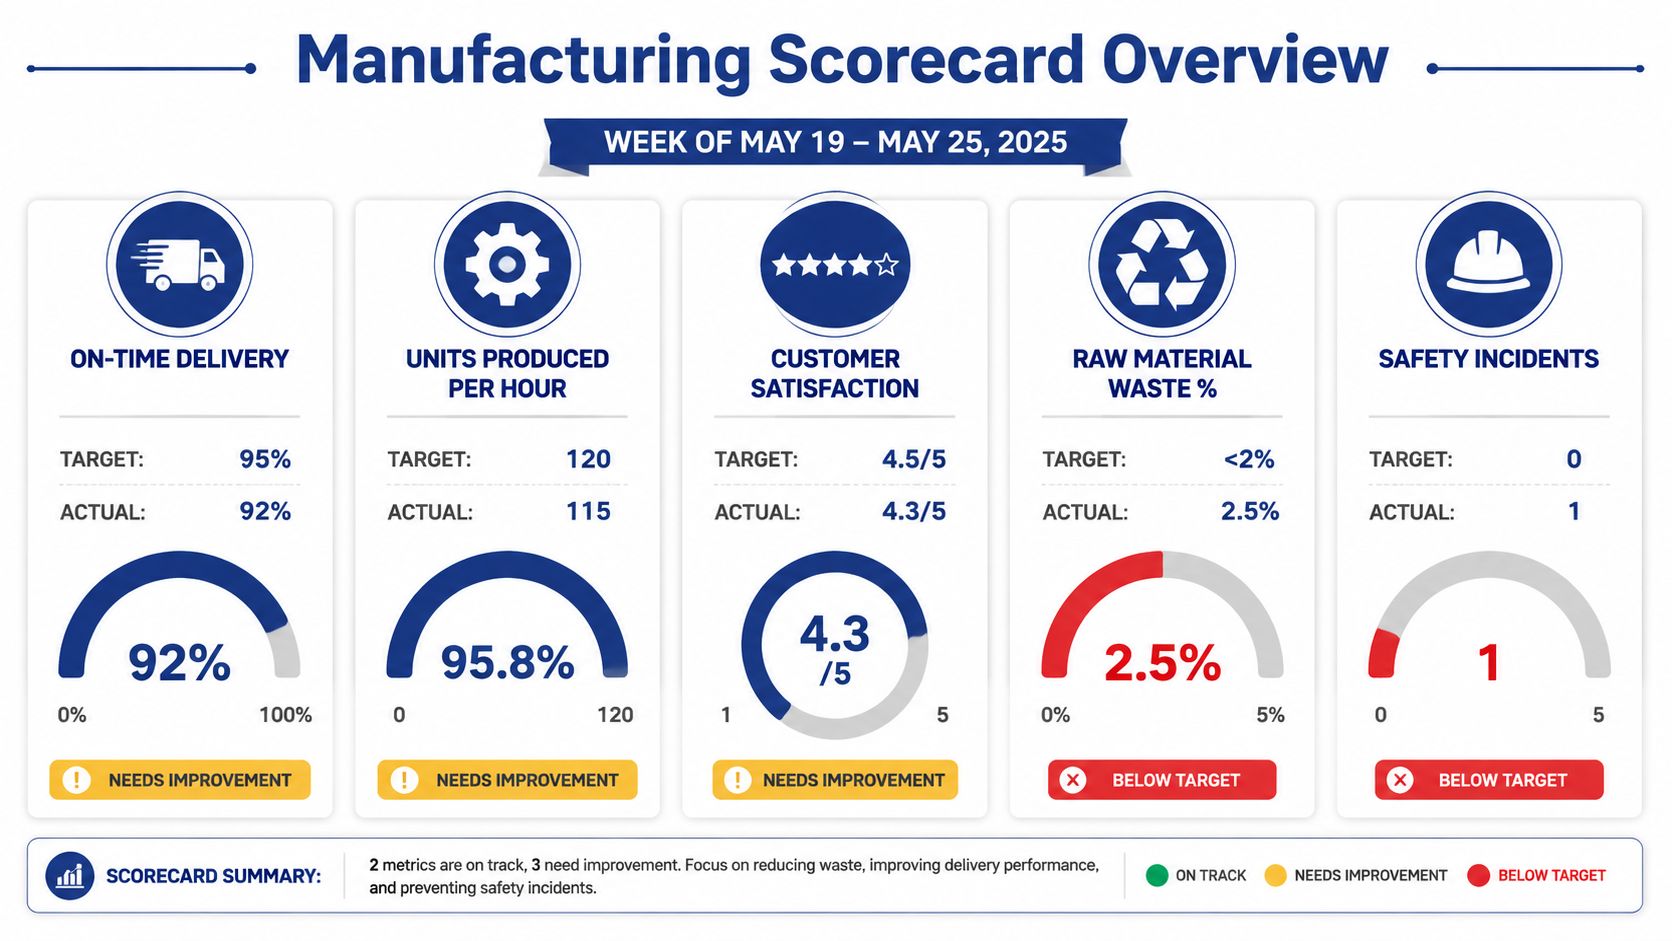
From Gut-Feel to Data with a Manufacturing Scorecard
Monday at 8:00 a.m., the leadership team says the plant had a decent week. By Thursday, customer service is chasing late orders, overtime is climbing, and margin on two jobs has disappeared. Nothing changed that fast. The team was running on opinions, month-end reports, and partial updates from different departments.
A manufacturing scorecard fixes that by giving the leadership team a short list of weekly numbers that show drift early enough to act. EOS uses a weekly scorecard to track a small set of measurable indicators. The point is not reporting for its own sake. The point is to connect EOS discipline to what drives performance in a plant: quoting speed, schedule stability, quality, downtime, and shipment flow.
What belongs on a weekly scorecard
The best scorecards use leading indicators. Monthly revenue, booked sales, and closed invoices matter, but they explain results after the week is gone. A useful manufacturing scorecard shows whether the business is building toward a miss or toward a good week.
That usually means tracking measures like these:
- Commercial flow: Quote volume, quote turnaround time, opportunities advanced, stalled target accounts
- Production flow: Schedule adherence, output by constraint, backlog movement, machine uptime
- Quality flow: Scrap rate, first-pass yield, open corrective actions, repeat defects
- Delivery flow: On-time shipment, expedite count, past-due order aging
- People flow: Open critical roles, attendance gaps, cross-training completion
These numbers should reflect how the business runs. A make-to-order fab shop may need quote turnaround, rework hours, and schedule changes by day. A repeat-production manufacturer may care more about line uptime, attainment to plan, and premium freight. The scorecard has to match the production model, not a generic EOS template.
For teams building maintenance measures into EOS, these essential reliability metrics resources help standardize terms like MTBF, MTTR, and OEE so production, maintenance, and leadership are reading the same numbers the same way.
Example Manufacturing Scorecard Metrics
| Department | Metric (Measurable) | Weekly Goal |
|---|---|---|
| Sales | Quote volume | Set by leadership team |
| Sales | Quote turnaround time | Set by leadership team |
| Operations | Schedule adherence | Set by leadership team |
| Operations | Machine uptime | Set by leadership team |
| Quality | Scrap rate | Set by leadership team |
| Quality | First-pass yield | Set by leadership team |
| Shipping | On-time delivery | Set by leadership team |
| Engineering | ECOs released on schedule | Set by leadership team |
A scorecard works when every number causes a useful conversation. If on-time delivery slips, the team should be able to trace that miss back to earlier signals such as schedule changes, material shortages, downtime, or labor gaps. If quote turnaround stretches from two days to six, sales pipeline growth will slow next. Manufacturers that want tighter commercial reporting can borrow the same discipline operations uses. This primer on marketing analytics for industrial teams is a useful example of how to define inputs, review them weekly, and tie them to sales outcomes.
What good scorecard behavior looks like
Each measurable needs one owner. One person reports the number, knows how it is calculated, and brings context when it misses. Department ownership sounds tidy on paper, but it creates delay and excuses.
The common failure points are predictable:
- Too many metrics: The team cannot see the few numbers that require attention
- No clear owner: Numbers get updated, but no one manages performance
- Late reporting: The meeting turns into a reconstruction of last week
- Loose definitions: People debate the math instead of solving the issue
Strong scorecard behavior is simpler.
- Clear definitions: Everyone calculates the metric the same way
- Fast access to data: The owner can report it without chasing five systems
- Leading indicators: The number moves before the customer feels the problem
- Action on misses: A red number gets corrected quickly or moved into IDS for deeper problem solving
If a number cannot trigger a decision, it does not belong on the scorecard.
Perfect data is not the standard. Consistent data is. In manufacturing, a scorecard starts paying off when the team trusts the numbers enough to change schedule rules, rebalance capacity, push back on bad-fit orders, or fix a quoting bottleneck before it shows up in revenue.
The 90-Day Rhythm of Rocks and Level 10 Meetings
Quarterly focus is where most manufacturers either gain traction or create another layer of administrative clutter. The difference comes down to restraint. EOS frames the core sequence as setting 3 to 7 quarterly Rocks, enforcing a weekly Level 10 Meeting cadence, and using a scorecard to track leading indicators, as outlined in this EOS traction overview.

How to choose rocks without creating noise
A Rock is not routine work. It's not “run production,” “ship orders,” or “maintain quality.” It's a priority that must move this quarter because it removes a constraint or advances the annual plan.
Strong manufacturing Rocks often sound like this:
- Stabilize scheduling: Implement one scheduling rule set across sales, planning, and production.
- Fix a chronic quality issue: Reduce recurrence by standardizing containment and corrective-action ownership.
- Clean up quoting: Create a standard quote process for target accounts so lead times and pricing are consistent.
- Improve maintenance discipline: Build a weekly review around downtime causes and PM completion.
- Strengthen commercial follow-up: Define ownership for dormant opportunities and customer reactivation.
Weak Rocks tend to be broad, political, or impossible to finish in a quarter. “Improve communication” is not a Rock. “Launch a daily handoff between sales and planning with one owner and one format” is.
A useful test is whether a Rock has a finish line. If the owner can't say what “done” looks like, it's still a wish.
A Level 10 meeting should solve issues, not perform updates
A weekly Level 10 Meeting creates the discipline that many manufacturers try to get through sheer pressure. It gives the leadership team a fixed place to review scorecard misses, check Rock status, and solve issues while they're still manageable.
The meeting fails when leaders use it for narration. “Here's what my department did this week” is not useful unless it connects to a measurable or an issue. Plants already have enough update meetings.
Use the meeting to answer a tighter set of questions:
- Which numbers are off?
- Which Rocks are off track?
- Which issues threaten the quarter right now?
- Who owns the next action?
A lot of teams also benefit from seeing the cadence in action before they force it into the calendar. This walkthrough is a good visual reference:
Use the meeting pulse to protect the quarter
A 90-minute meeting only works if the inputs are disciplined before the meeting starts. The scorecard has to be updated. Rock owners have to know their status. Issues have to be captured when they occur, not remembered in the room.
Here's where manufacturers often need a correction. They overfill the quarter. The company sets too many Rocks, each function sets too many more, and by week four the business is juggling a dozen “top priorities.” That's not traction. That's multitasking with better vocabulary.
Field note: If everything is a Rock, your plant is still running on urgency.
A better quarterly rhythm usually includes:
- A small number of company Rocks that address the most important constraints.
- Department Rocks that support, rather than compete with, those priorities.
- A fixed weekly leadership meeting with the same cadence every time.
- A visible issues list so recurring problems don't vanish between meetings.
If your company is trying to grow while cleaning up operations, this same discipline also supports scaling decisions around structure, staffing, and process. This guide on how to scale a small business with clearer systems is useful when EOS starts exposing where informal growth habits are holding the business back.
Solving Problems from the Shop Floor to Sales
Tuesday morning, the plant misses schedule on a priority order, a customer asks why their quote is still sitting open, and the leadership team spends its weekly meeting arguing about symptoms. Production blames material shortages. Sales blames last-minute changes. Quality wants tighter checks. Engineering says the release was incomplete. Without a shared way to identify the core issue, the same problems keep coming back under different labels.
That is where manufacturers lose the value of EOS. The framework is supposed to help the business solve cross-functional problems in a consistent way. If it stays trapped at the leadership level, the plant keeps firefighting and the sales team keeps chasing work the operation cannot support.
A manufacturing company needs EOS tied to operating reality. That means using it against the points where work breaks down: machine loading, changeovers, engineering release timing, quoting flow, customer communication, and pipeline visibility. The article on applying the EOS traction model in operational settings is useful because it pushes EOS beyond theory and into day-to-day execution.

EOS fails when it stays in the conference room
The friction in a manufacturing business usually sits between functions, not inside one box on the org chart.
Production wants schedule stability because every disruption hurts throughput. Sales wants fast answers because slow quoting loses jobs. Engineering wants revision control because sloppy changes create scrap and rework. Quality wants containment before shipment because one escaped defect can damage a customer relationship. Maintenance wants planned downtime because unplanned downtime costs more.
All of those priorities make sense on their own. The problem is that they compete unless leadership uses one decision system to make trade-offs visible and assign ownership. That is why the Issues component matters. It gives the company a way to work on root causes instead of replaying the same weekly argument.
Use IDS on operational issues
IDS works well in manufacturing when the issue is specific and tied to evidence. Bring the metric, the missed commitment, or the recurring failure. Leave the vague frustration outside the room.
A common example is a line that keeps missing schedule:
- Symptom: Line 3 missed the weekly plan again.
- Wrong conclusion: Operators need to work faster.
- Real issue: Changeovers vary by crew, staged material is not ready on time, and a preventive maintenance task keeps getting pushed.
That diagnosis changes the action. Now the team can standardize the changeover process, tighten material staging ownership, and protect the maintenance window instead of pressuring operators to compensate for a broken system.
Quality problems follow the same pattern.
- Symptom: Customer complaints keep hitting the same part family.
- Weak response: Tell operators to be more careful.
- Better response: Review first-pass yield, trace where defects enter the process, confirm who owns inspection, and decide whether the failure starts in setup, training, work instructions, or engineering release.
The quality issue you keep “fixing” may be a scheduling issue, a training issue, or an engineering-release issue.
That sentence matters on the shop floor because manufacturers often solve the easiest visible problem, not the constraint that created it. IDS forces the team to slow down, identify the root cause, discuss trade-offs, and decide what changes.
Operational issues that belong on the IDS list include:
- Capacity conflicts: Too many rush jobs loaded onto the same machine group
- Material reliability: Late or partial receipts disrupting the production sequence
- Engineering flow: Changes released without enough production coordination
- Maintenance discipline: Repeat downtime with no closed-loop corrective action
- Quality recurrence: The same nonconformance returning under a different job
Use IDS on commercial bottlenecks too
Manufacturers make a costly mistake when they treat sales problems as separate from operating problems. Quoting delays, weak qualification, poor follow-up, and bad pipeline visibility are management system issues. They affect capacity planning, revenue confidence, and customer mix.
A plant can improve OEE and still miss growth targets if quotes sit too long or if the sales team keeps filling the funnel with low-fit work. The reverse is also true. Sales can win new business that the operation should not prioritize, which creates margin pressure and schedule instability. EOS helps when both sides review those issues inside the same cadence.
Use IDS on commercial bottlenecks such as:
- Low lead-to-quote ratio: Is traffic poor, is qualification weak, or is follow-up late?
- Quotes not converting: Is pricing inconsistent, is scope unclear, or is response time too slow?
- A key account has gone quiet: Did demand shift, or did your team stop creating useful reasons to engage?
- Sales and operations conflict: Is the sales team pursuing work that does not fit plant capacity, capability, or margin targets?
In practice, the weekly issues list should include more than plant concerns. It should also include quote turnaround, pipeline quality, distributor communication, account activity, and forecast reliability. Those are not side topics. They shape what the plant will be asked to run next month and next quarter.
Some manufacturers use outside support for that commercial discipline. Machine Marketing is one example for firms that need help connecting CRM use, content, and follow-up to a measurable sales process.
EOS should run the cadence, clarify ownership, and force decisions. Plant systems still have to run execution. Sales systems still have to generate and convert demand. Manufacturers get traction when those pieces work together, with the same priorities and the same issue-solving rhythm.
Conclusion Your First Step to Gaining Traction
A manufacturing business gets harder to run when growth adds complexity faster than your systems can absorb it. More customers, more SKUs, more engineering changes, more staffing pressure, and more urgency usually don't create clarity on their own. They expose the cost of vague ownership and inconsistent execution.
That's why EOS traction for manufacturers is useful when it's applied with discipline. The framework gives you a way to assign accountability, choose the few numbers that matter weekly, focus the quarter around a small number of priorities, and solve issues before they become part of company culture.
It also has limits. EOS won't replace lean practices, maintenance systems, ERP discipline, or a deliberate sales process. It won't make bad data clean by itself. It won't fix a broken pricing model. And it won't help if leaders refuse to make trade-offs. What it does do is create a repeatable management rhythm so those systems can work together instead of competing for attention.
If you're deciding where to start, keep it narrow. Don't launch every EOS tool at once. Don't try to convert the whole plant in a week. Start with the leadership team and one practical exercise: build the Accountability Chart and draft the V/TO. That step forces the right conversation early. Who owns what? What are we trying to become? Which work matters most? Which work is distracting us?
Get those answers on paper. Then commit to a weekly scorecard review and a real issues list. Once that cadence becomes normal, the rest of the system has somewhere to live.
A manufacturer gains traction the same way it improves a process. Not through a speech. Through visibility, ownership, standard work, and follow-through.
If you want help diagnosing where your growth system and operating system aren't connecting, Machine Marketing works with manufacturers to clarify strategy, tighten CRM and follow-up processes, and build the commercial structure that supports consistent execution.