
If you’re spending money on marketing but can't confidently say what's working, you’re not alone. The simple formula for marketing ROI—(Revenue – Cost) / Cost—hides a much bigger challenge: connecting specific marketing efforts to the revenue they bring in, especially with long B2B sales cycles.
The problem isn't the math. It’s the measurement system. In this guide, we’ll show you how to diagnose the gaps in your current reporting and build a system that proves the financial impact of your marketing.
Why Most Marketing ROI Reports Are Useless

Are you tired of marketing reports filled with "vanity metrics" like clicks and impressions that don't connect to your bottom line? We see this constantly with new clients. They know they're spending money, but they can’t prove what it's generating.
The issue is a fundamental disconnect between marketing activities and actual revenue. Most reports focus on what’s easy to track, not what truly matters. This creates a massive blind spot where budgets are allocated based on activity instead of real financial impact.
Diagnosing the Measurement Problem
A typical B2B purchase can take months and involve dozens of touchpoints. A prospect might download a whitepaper, see you at a trade show, read a few blog posts, and then finally request a demo.
When your reporting system only gives credit to that final form submission, you're ignoring all the critical work that built awareness and trust along the way.
This broken perspective leads to common problems:
- Misleading Metrics: Focusing on top-of-funnel numbers like website traffic tells you nothing about lead quality or whether your sales pipeline is growing.
- Incorrect Budgeting: Without clear data, you might pour money into channels that generate junk leads while cutting the budget for the content or SEO that nurtures high-value customers.
- Lack of Accountability: When your marketing team can't prove its financial contribution, it's treated like a cost center instead of a growth engine, making it impossible to secure the resources needed to succeed.
The hard truth is that old-school ROI frameworks don't work for modern B2B marketing. They try to distill months of complex relationship-building into an oversimplified metric that ignores how deals actually get done.
Shifting Focus to Financial Impact
To truly measure marketing ROI, you have to change your entire mindset. Stop tracking activity and start measuring impact. It's about connecting every marketing dollar to a tangible business outcome.
You need a system built to answer the questions your CEO is really asking.
Instead of asking, "How many clicks did our ad campaign get?" start asking:
- How many qualified leads did that campaign hand over to our sales team?
- What was our cost per qualified lead from that channel?
- What percentage of those leads turned into real, sales-accepted opportunities?
- And ultimately, what was the total revenue generated from the deals that started with this campaign?
Answering these questions changes the conversation. You go from defending your budget to demonstrating its value in plain financial terms. The next sections provide a clear framework for building a measurement system that delivers this clarity.
Building Your ROI Measurement Blueprint
Before you calculate anything, you need a plan. A real ROI measurement blueprint is about getting crystal clear on what success actually looks like for your business. It's the only way to move from measuring marketing activity to measuring business impact.
Too many business owners get stuck chasing metrics like clicks or impressions that don’t tie back to the bottom line. This blueprint is designed to shift your focus from activity to outcomes, ensuring every number you track has a purpose.
From Vague Goals to SMART Objectives
It all starts by translating big, fuzzy business goals into sharp, specific marketing objectives. A goal like "we need to increase web traffic" is a starting point, but it's not a destination. It’s too vague to drive smart decisions.
This is where the SMART objective framework is invaluable: Specific, Measurable, Achievable, Relevant, and Time-bound. It forces you to define exactly what you want to do, by when, and how you’ll know if you got there.
Here’s what that looks like in practice for a B2B manufacturer:
- The Vague Goal: "We need more leads from our website."
- The SMART Objective: "Generate 50 new Marketing Qualified Leads (MQLs) from organic search in Q3, with a target Cost Per Lead (CPL) of $150 or less."
The second objective is powerful because it’s precise. It gives your team a clear target, a timeline, and a budget constraint. More importantly, it connects directly to the sales pipeline. Getting this right is a fundamental part of how to build a marketing plan that works.
Translating Objectives Into Key Performance Indicators
Once you have a rock-solid objective, the right Key Performance Indicators (KPIs) become obvious. Think of KPIs as the vital signs of your marketing engine. They are the specific metrics that tell you if you're on track to hit your target.
For our B2B manufacturer trying to generate 50 MQLs, the essential KPIs are:
- Primary KPI: Number of MQLs from organic search. This is the ultimate pass/fail metric.
- Secondary KPIs:
- Organic Traffic to Key Service Pages: Are we getting the right visitors?
- Conversion Rate on Demo Request Forms: How effective are we at turning visitors into leads?
- Cost Per Lead (CPL): Are we hitting our efficiency targets?
Every KPI serves a diagnostic purpose. If MQLs are low, you don’t have to guess why. A quick look at your secondary KPIs will tell you if the problem is traffic or conversion. This approach lets you stop guessing and start solving problems methodically.
Mapping Business Goals to Marketing KPIs for B2B
Translating high-level company ambitions into the metrics your marketing team tracks daily is the key to alignment. Without this connection, marketing can feel like an isolated cost center.
The table below shows how you can create a direct line of sight from a broad business goal all the way down to a specific KPI.
| Business Goal | Marketing Objective | Primary KPI | Secondary Metrics |
|---|---|---|---|
| Increase Market Share by 10% | Generate 200 Sales Qualified Leads (SQLs) from the new product line in H2 | Number of SQLs | MQL-to-SQL Conversion Rate, Demo Completion Rate, Cost Per SQL |
| Improve Customer Retention | Increase customer lifetime value (CLV) by 15% in the next 12 months | Customer Lifetime Value (CLV) | Churn Rate, Average Order Value (AOV), Repeat Purchase Rate |
| Expand into a New Geographic Region | Establish brand awareness and generate 1,000 net-new contacts in the target region in Q4 | Number of New Contacts (Leads) | Website Traffic from Region, Regional Keyword Rankings, Lead Conversion Rate |
| Drive Revenue Growth by 20% | Generate $500,000 in marketing-attributed revenue from paid advertising campaigns | Marketing-Attributed Revenue | Return on Ad Spend (ROAS), Customer Acquisition Cost (CAC), Pipeline Velocity |
This simple exercise ensures every marketing action is directly tied to a tangible business outcome, making your reporting far more meaningful.
The goal is to create a direct line of sight from your highest-level business ambitions down to the daily metrics your team tracks. When every KPI has a clear reason to exist, your reporting becomes a powerful tool for growth.
The discipline of measuring marketing's financial impact has matured fast. Top advertisers now see a median profit ROI of 2.5:1, up from 1.9:1 in 2017. What’s driving this? Data. Marketing teams now work with roughly 230% more data than in 2020. Your board now expects the same level of financial clarity from marketing that they get from operations or sales. A solid ROI blueprint isn't just good practice—it's a necessity.
Connecting Marketing Activities to Revenue
So, you have your objectives and KPIs. Now for the step where most businesses get stuck. How do you prove that a specific ad campaign led to a deal that closed months later?
This is where marketing attribution comes in—the process of assigning credit to the different touchpoints a customer interacts with on their journey. Without a clear attribution model, you can't confidently answer the big question: "What marketing is actually driving revenue?"
The reality for B2B companies is that the customer journey is never a straight line. It's a winding path with multiple touchpoints over a long sales cycle. Ignoring this complexity is the fastest way to get your ROI calculations wrong.
This decision tree helps visualize how to build a solid ROI blueprint, starting from high-level business goals and drilling down to specific KPIs.
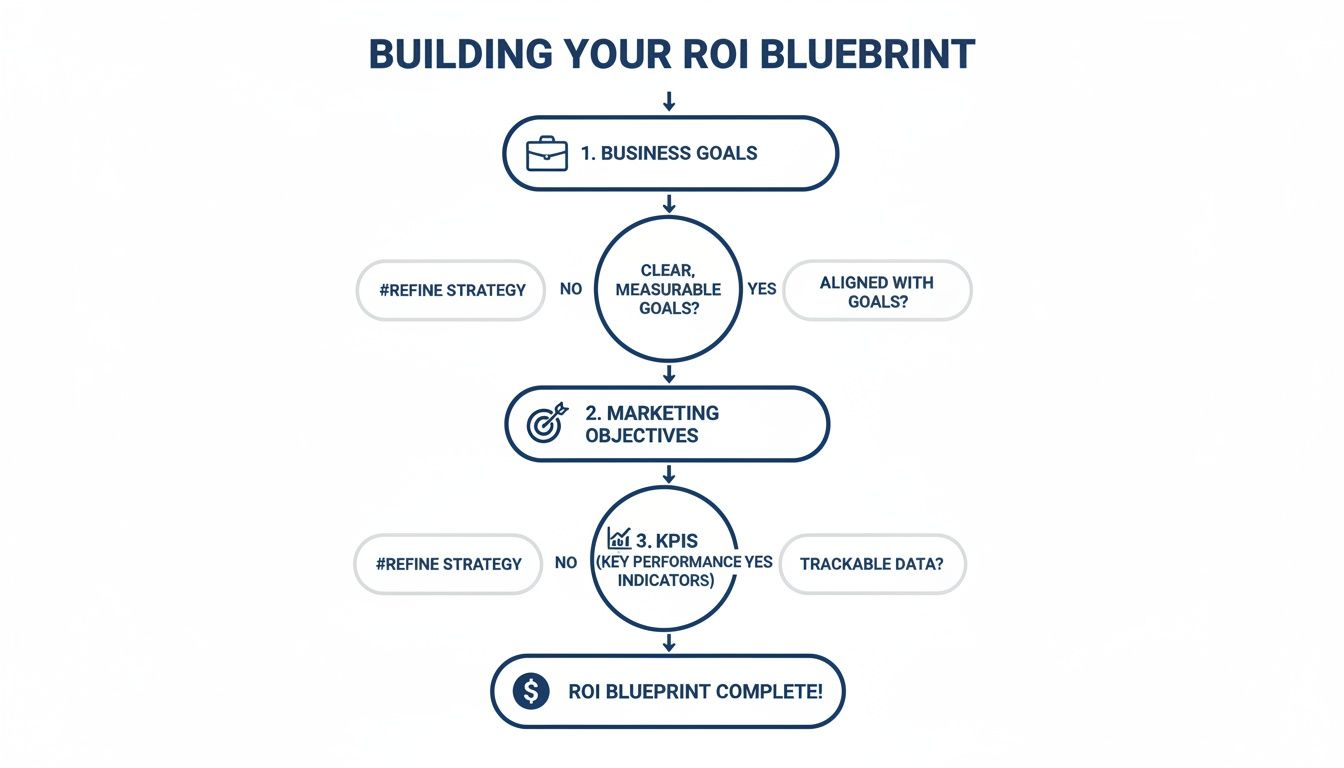
As you can see, every KPI you track should have a direct line back to a core business goal. This ensures your entire measurement system is built on a foundation of purpose.
Choosing the Right Attribution Model
There is no single "best" attribution model. The right one depends on your sales cycle, business model, and what you’re trying to learn. Let's break down the common options.
Single-Touch Attribution Models
These are the simplest models, giving 100% of the credit for a sale to just one touchpoint.
- First-Touch Attribution: Credit goes to the very first interaction (e.g., the first whitepaper they downloaded). This is great for understanding which channels generate initial awareness.
- Last-Touch Attribution: Credit goes to the final interaction before conversion (e.g., the Google Ad they clicked before requesting a quote). This helps identify what pushes leads over the finish line.
The glaring problem with single-touch models is that they ignore everything that happens in the middle of a long B2B sales cycle.
Multi-Touch Attribution Models
These models are more sophisticated because they spread credit across multiple touchpoints, giving you a much more realistic picture.
- Linear Model: Credit is split evenly among all touchpoints. It's simple but assumes every interaction is equally valuable.
- Time-Decay Model: Touchpoints closer to the sale get more credit. This is useful for shorter sales cycles.
- U-Shaped Model: This model gives the most credit to the first touch and the last touch (typically 40% each), distributing the remaining 20% among the interactions in between. It rightly emphasizes what started the journey and what closed the deal.
For most B2B companies with longer sales cycles, a multi-touch model is almost always the superior choice. It acknowledges that building trust over time is just as important as the first discovery.
Your attribution model is the engine of your ROI calculation. Choosing a simple model like last-touch is like trying to understand a movie by only watching the final scene. You’ll get an answer, but you’ll miss the entire plot.
The Practical Side of Data Collection
A great attribution model is useless without clean, connected data. To get a unified view of the customer journey, you have to pull information from several key systems and ensure they can talk to each other.
Here’s the essential tech stack you need:
- Website Analytics (like Google Analytics 4): Your command center for understanding where visitors come from and what they do on your site.
- Customer Relationship Management (CRM): Where all your lead and customer data lives, tracking every interaction with your sales team.
- Ad Platform Pixels (e.g., Google Ads, LinkedIn): Critical for tracking conversions from your ads and connecting spend directly to lead generation.
The real magic happens when you integrate these systems. Connecting your CRM to your marketing platform lets you see the full story—from the ad that generated a lead to that lead becoming a customer. Many of our clients find that implementing robust marketing automation strategies is the key to creating this seamless data flow.
Finally, data hygiene is non-negotiable. Simple mistakes like inconsistent UTM tracking or duplicate CRM contacts can completely derail your ROI calculations. A system is only as good as the data you feed it.
The Practical Formula for Calculating ROI

With your data flowing and an attribution model chosen, it’s time to do the math. The power of the ROI formula comes from how honestly you define each number in the equation.
The core formula is: (Net Profit from Marketing – Total Marketing Cost) / Total Marketing Cost
This gives you a ratio or percentage that shows the return on every dollar you spent. For example, an ROI of 4.0 means you generated $4 in net profit for every $1 invested—a 400% return.
What Really Goes into "Total Marketing Cost"?
This is where many businesses get it wrong. They only count ad spend, which inflates their ROI and gives them a false sense of success.
To get a true ROI figure, you need to account for everything. Your Total Marketing Cost should always include:
- Direct Ad Spend: What you pay platforms like Google or LinkedIn.
- Team Salaries & Freelancers: The cost of the people running the campaigns (you can allocate a percentage of their salaries).
- Software & Tools: A portion of your spend on your CRM, marketing automation, and analytics tools.
- Content & Creative Production: The cost of designing ads, writing copy, or developing landing pages.
If you skip these "soft costs," you aren't calculating ROI. You're calculating Return on Ad Spend (ROAS), which is a useful metric but doesn't tell you if your marketing effort is truly profitable.
A Walk-Through: Calculating ROI for a Manufacturer
Let’s put this into practice. Imagine a B2B manufacturer runs a Google Ads campaign to generate Request for Quote (RFQ) submissions. Here’s a step-by-step breakdown of the numbers after a three-month campaign.
Sample ROI Calculation for a B2B Google Ads Campaign
This table breaks down the metrics, formulas, and example values for a typical B2B lead generation campaign.
| Metric | Formula / Definition | Example Value | Notes |
|---|---|---|---|
| Total Marketing Cost | (Ad Spend + Mgmt Fees + Creative + Salary) | $25,000 | This includes $15k ad spend, $6k agency fee, $1.5k landing page, $2.5k salary. |
| Total Leads (RFQs) | Number of qualified inquiries from the campaign | 20 | Sourced directly from the campaign's landing page form submissions. |
| Lead-to-Deal Conversion Rate | (Closed Deals / Total Leads) * 100 | 20% | 4 deals closed out of 20 total leads. |
| Average Deal Value | Total revenue from closed deals / Number of deals | $50,000 | The average sale price for one of the CNC machines. |
| Total Revenue Generated | (Closed Deals * Average Deal Value) | $200,000 | 4 deals * $50,000 per deal. |
| Profit Margin | Percentage of revenue that is profit | 25% | After accounting for cost of goods sold (COGS). |
| Net Profit Generated | (Total Revenue * Profit Margin) | $50,000 | $200,000 in revenue at a 25% margin. |
| Final ROI | (Net Profit – Total Cost) / Total Cost | 1.0 or 100% | ($50,000 – $25,000) / $25,000. |
The final ROI is 1.0, or a 100% return. For every dollar the manufacturer put into this campaign, they got that dollar back plus another dollar in pure profit. Now that’s a number you can confidently take to your leadership team.
For a deeper dive, check out this practical guide on how to calculate marketing ROI for more examples.
Going Deeper with LTV and CAC
While campaign-level ROI is fantastic for tactical decisions, strategic companies also focus on two bigger-picture metrics: Customer Lifetime Value (LTV) and Customer Acquisition Cost (CAC).
- Customer Acquisition Cost (CAC): Your total marketing and sales cost divided by the number of new customers won. It answers: "How much does it cost us to get a new customer?"
- Customer Lifetime Value (LTV): The total net profit you expect from an average customer over their entire relationship. It answers: "How much is one customer really worth to us long-term?"
The LTV:CAC ratio is one of the most powerful indicators of your business's health. A healthy ratio is generally considered to be 3:1 or higher—meaning a customer brings in at least three times more value than it cost to acquire them.
If your LTV:CAC ratio is 1:1, you’re breaking even on new customers. If it’s 5:1, you’ve built a highly efficient growth engine and should invest more aggressively to scale it.
Turning Your Data Into Smarter Decisions
Calculating marketing ROI is a vital diagnostic, but the number itself doesn't grow your business. An ROI calculation is only worthwhile if it leads you to make smarter, faster decisions.
This is the final and most important piece of the puzzle: turning your measurement system into a growth engine. The goal isn't just to report on what happened last month. It's about using that data to proactively shape what happens next quarter.
You need a system that makes insights obvious, allowing you to spot trends and identify top-performing channels at a glance.
Visualizing Your Key Metrics
Raw data trapped in a spreadsheet is a recipe for inaction. The answer is a simple marketing dashboard that brings your key ROI metrics to life.
This isn't about building overwhelming charts. It's about focusing on the handful of critical numbers that tell you if you're winning or losing. At a minimum, your dashboard should instantly answer:
- Which channels are delivering the highest ROI?
- What's our current Customer Acquisition Cost (CAC)?
- How is our LTV:CAC ratio trending this quarter?
- Which campaigns are driving qualified leads?
Tools like Google Data Studio or the built-in dashboards in a platform like HubSpot can pull everything together. The key is to keep it clean, focused, and tied to the KPIs you defined from the start. Our guide on what is marketing analytics can help you get started.
Establishing a Reporting Cadence
Data without a routine for review is just noise. To make your dashboard actionable, you need a consistent reporting cadence to regularly check performance, diagnose issues, and make adjustments.
Here’s a simple, effective rhythm we implement with our clients:
- Weekly Review (Pulse Check): A quick, 15-minute look at leading indicators like ad spend and leads generated. You’re looking for big red flags that need immediate attention.
- Monthly Review (Performance Diagnosis): A deeper dive into channel and campaign performance. This is where you calculate ROI for major initiatives and look for trends.
- Quarterly Review (Strategic Shift): Where you make big-picture decisions. Review your overall ROI and LTV:CAC ratio. This is the time to reallocate budgets, double down on what’s working, and cut what isn’t.
An ROI report isn’t a historical document you file away. It’s a recurring diagnostic tool. It tells you what’s healthy, what’s sick, and where to focus your resources for the biggest impact.
From Diagnosis to Actionable Next Steps
Let's say your monthly review reveals that your email marketing campaigns have a 3x higher ROI than your paid social media ads. This discovery is your cue to shift from measuring to optimizing.
- Reallocate Your Budget: The most obvious move is to shift a portion of your social ad budget to email. This single decision can immediately boost your overall marketing profitability.
- Diagnose the Underperformer: Don't just abandon social ads. Ask why the ROI is so low. Is the targeting off? Is the creative stale? Use the data to form a hypothesis and run a test to fix the performance gap.
- Systematize Your Success: Dig into why your email ROI is so high. Is it a specific type of content or sequence? Identify the pattern and build a system to replicate that success.
This kind of optimization is increasingly powered by AI-driven analytics. With 83% of marketing leaders stating that demonstrating ROI is their top priority, leveraging advanced analytics is no longer optional. As these marketing ROI statistics show, it directly determines which channels get funded and drives a massive competitive advantage.
Common Questions About Measuring Marketing ROI
Even with a solid framework, some questions always come up. Getting clear on these points is what separates a trustworthy measurement system from a confusing one.
What Is a Good Marketing ROI?
The honest answer is: it depends. There’s no magic number because "good" is tied to your industry, business model, and profit margins.
A widely accepted benchmark is a 5:1 ratio—generating $5 in revenue for every $1 spent. An exceptional ROI is closer to 10:1. But for a business with tighter margins or a long sales cycle, a 3:1 ratio could be incredibly profitable.
The most important goal isn't hitting an arbitrary industry number; it's being consistently positive. We advise clients to first establish their own baseline ROI. From there, the real goal is continuous, quarter-over-quarter improvement.
How Do I Measure ROI for Long B2B Sales Cycles?
This is a huge challenge when a deal can take over a year to close. You can't afford to wait that long to see if your marketing is working.
The solution is to track leading indicators by assigning a projected value to key milestones in your sales funnel.
Here’s how it works:
- Assign a value to key actions. If you know that 10% of prospects who complete a demo become customers, and your average deal is $50,000, then every completed demo has a projected value of $5,000.
- Track milestone conversions. Your primary KPIs for a campaign might shift to "demos scheduled" or "MQLs generated" instead of just closed deals.
- Calculate leading-indicator ROI. Now you can measure the projected value your campaigns are generating against your costs, giving you feedback long before contracts are signed.
This approach gives you a near-real-time pulse on campaign performance and requires a well-configured CRM to track leads accurately.
How Do I Track ROI for SEO and Content Marketing?
Measuring the return on long-term strategies like SEO and content requires a different mindset. You can’t track it like a pay-per-click ad, but it is absolutely measurable by connecting organic activity to conversions.
The most effective way is to track how many leads and sales were influenced by your organic content at some point in their journey.
Inside Google Analytics, you can set up conversion goals for actions like contact form submissions. The "Assisted Conversions" report is your best friend here. It shows you every time organic search was a touchpoint, even if it wasn't the final click. By assigning a value to these goals, you can calculate the total revenue influenced by your SEO efforts.
What Are the Most Common Mistakes When Measuring ROI?
Building a reliable system is often about avoiding preventable mistakes. From our experience, these are the four biggest traps to watch for:
- Using simplistic attribution. Only looking at the first or last touch ignores the middle of the customer journey, undervaluing the channels that build awareness and trust.
- Forgetting to include all costs. Only counting direct ad spend gives you an inflated ROI. You must include salaries, software fees, and creative costs to get a true picture.
- Focusing on vanity metrics. Chasing website traffic or social media followers feels productive but doesn't pay the bills. Track revenue-driving actions like qualified leads instead.
- Working with messy data. Disconnected systems and inconsistent tracking make it impossible to connect marketing to sales. Clean, structured data is the foundation for everything.
At Machine Marketing, we build marketing systems that provide the clarity you need to make smart, profitable decisions. If you're tired of guessing and ready to build a measurement framework that proves the value of your marketing, it all starts with a simple diagnosis.
Book a discovery call with us today to start building a scalable system for sustainable growth at https://machine-marketing.com.