
You're probably seeing a version of this already. Marketing sends a monthly report. It shows website traffic, ad clicks, email opens, maybe a few form fills. Sales says the leads aren't right. Operations says lead times are tight. Finance asks what marketing produced. Nobody can draw a clean line from spend to closed revenue.
That's the core problem with marketing KPIs for manufacturing. The issue isn't typically a KPI problem. Instead, it's a measurement system problem. If you fix the system, the right KPIs become obvious, and weak metrics lose their power fast.
Table of Contents
- Why Most Manufacturing Marketing Metrics Fail
- A Practical KPI Framework for Your Business
- Tracking Your Pipeline From First Touch to Qualified Lead
- Connecting Digital Efforts to Bottom-Line Revenue
- How to Build Your Marketing Measurement System
- Common KPI Mistakes and How to Correct Them
- Your First 90-Day KPI Implementation Plan
Why Most Manufacturing Marketing Metrics Fail
Manufacturing companies rarely fail because they track too little. They fail because they track what's easy instead of what's useful.
Website sessions, social engagement, and raw lead counts can all move in the right direction while revenue stays flat. That happens when the reporting stops at activity. It never follows the prospect through qualification, sales review, opportunity creation, and closed business.
The more technical answer is simple. In manufacturing, the most useful KPIs are the ones that connect campaign activity to pipeline stage progression, not vanity engagement. For long-cycle industrial sales, tracking lead-to-opportunity conversion rate, marketing-sourced revenue, and pipeline contribution by source helps separate qualified demand from empty clicks, especially when buying groups involve multiple stakeholders. That's why tagging every lead by source in CRM and tracking movement to opportunity and revenue matters, as explained in Act-On's manufacturing marketing metrics guidance.
Practical rule: If a metric can't help you decide where to move budget, tighten qualification, or improve revenue attribution, it probably doesn't belong on the CEO dashboard.
The reporting trap
Most bad KPI setups share the same flaws:
- They reward attention, not progress. More traffic looks positive even if the traffic never becomes an opportunity.
- They isolate marketing from sales. Marketing reports one system. Sales works in another. Leadership gets two stories.
- They treat a lead like a buyer. In industrial markets, one contact rarely represents the full buying group.
- They ignore time. Long cycles mean weak attribution if you only look at what happened this month.
A manufacturer can spend steadily on SEO, paid search, email, trade media, and events, then still feel blind because nobody defined the checkpoints that matter. The result is a familiar pattern: teams debate channel opinions instead of diagnosing funnel behavior.
Questions worth asking immediately
Ask these in your next reporting meeting:
- Can we see lead source at the CRM level for every inbound lead?
- Can we measure how many leads became real sales opportunities?
- Can sales reject a lead with a defined reason code?
- Can we see which channels influence pipeline, not just inquiries?
- Can operations support the demand we're trying to create?
If the answer to several of these is no, the issue isn't campaign performance yet. It's instrumentation.
A Practical KPI Framework for Your Business
A manufacturer usually knows the weekly numbers that matter on the plant floor. Yield, scrap, on-time delivery, backlog, margin by job. Marketing often gets measured with a different standard, which is why leadership ends up with activity reports instead of a control system.
The fix is to build KPI reporting the same way you would build an operating dashboard. Start with the business outcome, define the stages that produce it, then choose the few measurements that show whether the system is working.
Start with business logic, not platform reports
Platform metrics are easy to pull and easy to misuse. A report full of sessions, clicks, impressions, and form fills can look healthy while sales sees no change in quoting activity or pipeline quality.
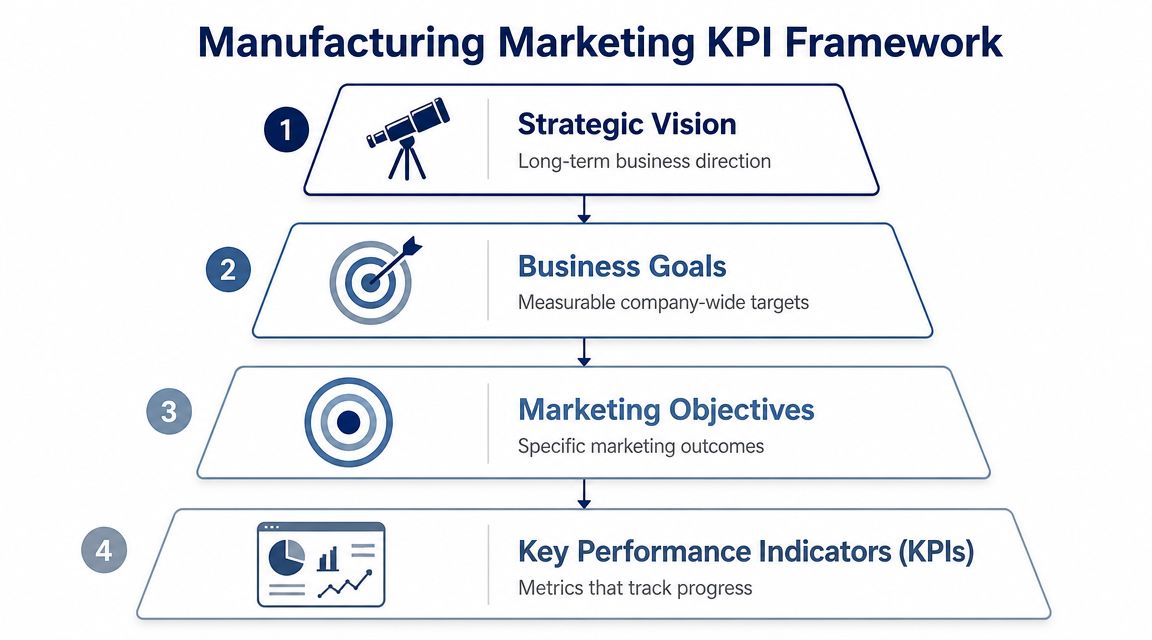
A workable hierarchy is simple:
- Strategic vision. Where the company is trying to win.
- Business goals. Revenue growth, share in a target sector, expansion into a new region, stronger distributor performance, or adoption of a new product line.
- Marketing objectives. Create qualified demand, increase engagement from target accounts, improve sales acceptance, support entry into a new vertical, or strengthen retention and expansion.
- KPIs. The measurements that confirm progress or expose failure.
This structure gives leadership one chain of logic from spend to outcome. It also prevents a common problem in manufacturing firms. Marketing chases inquiry volume while the business needs fewer, better opportunities from the right accounts.
If you need a clear operating model for how those opportunities should move through the business, use this guide to build a sales pipeline that matches B2B buying stages.
The four KPI categories that matter
For industrial companies, four KPI groups are usually enough. Each serves a different purpose. Mixing them together causes bad decisions.
Lead KPIs
These measure input quality. They answer a basic question: are the right people and accounts entering the system?
Examples include inbound leads from target industries, target account engagement, and MQL volume if the qualification bar is strict. If the team counts every brochure download as a lead, this category becomes noise.
Funnel KPIs
These measure progression. They show where momentum holds and where it breaks.
Useful examples include lead-to-MQL, MQL-to-SAL, SAL-to-SQL, lead-to-opportunity, and opportunity creation rate by source. These are diagnostic metrics. They help isolate whether the problem sits in targeting, qualification, follow-up speed, or offer fit.
Digital KPIs
These measure channel efficiency. They matter, but only in context.
Use metrics such as CPC, CPM, CTR, landing page conversion rate, and cost per qualified lead to judge whether media and messaging are producing economically sensible demand. A low CPC is irrelevant if the traffic never becomes pipeline. A high CPC can be acceptable if the channel consistently produces opportunities in the right accounts.
Revenue KPIs
These measure commercial impact. They belong on the CEO dashboard.
Track marketing-sourced pipeline, marketing-influenced revenue, customer acquisition cost, average deal value by source, sales cycle length by source, and contribution margin where attribution is reliable enough to support it. These numbers tie marketing to the same financial reality as production, sales, and operations.
Effective KPI systems make the business easier to steer, not just make marketing look busy.
The key trade-off is complexity versus control. Too few KPIs and you cannot diagnose failure. Too many and nobody uses the report. For most manufacturers, the right answer is a short executive dashboard supported by a deeper working-level view for sales and marketing. Leadership should be able to ask four questions and get a straight answer. Are we attracting the right demand? Is it advancing through the pipeline? Are channels efficient enough to keep funding? Is the result turning into profitable revenue?
Tracking Your Pipeline From First Touch to Qualified Lead
If your lead reporting ends at form submissions, you're missing the part that matters.
Manufacturing sales cycles tend to involve engineers, procurement, operations, finance, and sometimes distribution partners. One downloaded spec sheet doesn't equal buying intent. The true signal appears when a contact, or better yet an account, moves through defined stages and survives each handoff.
What each lead stage should tell you
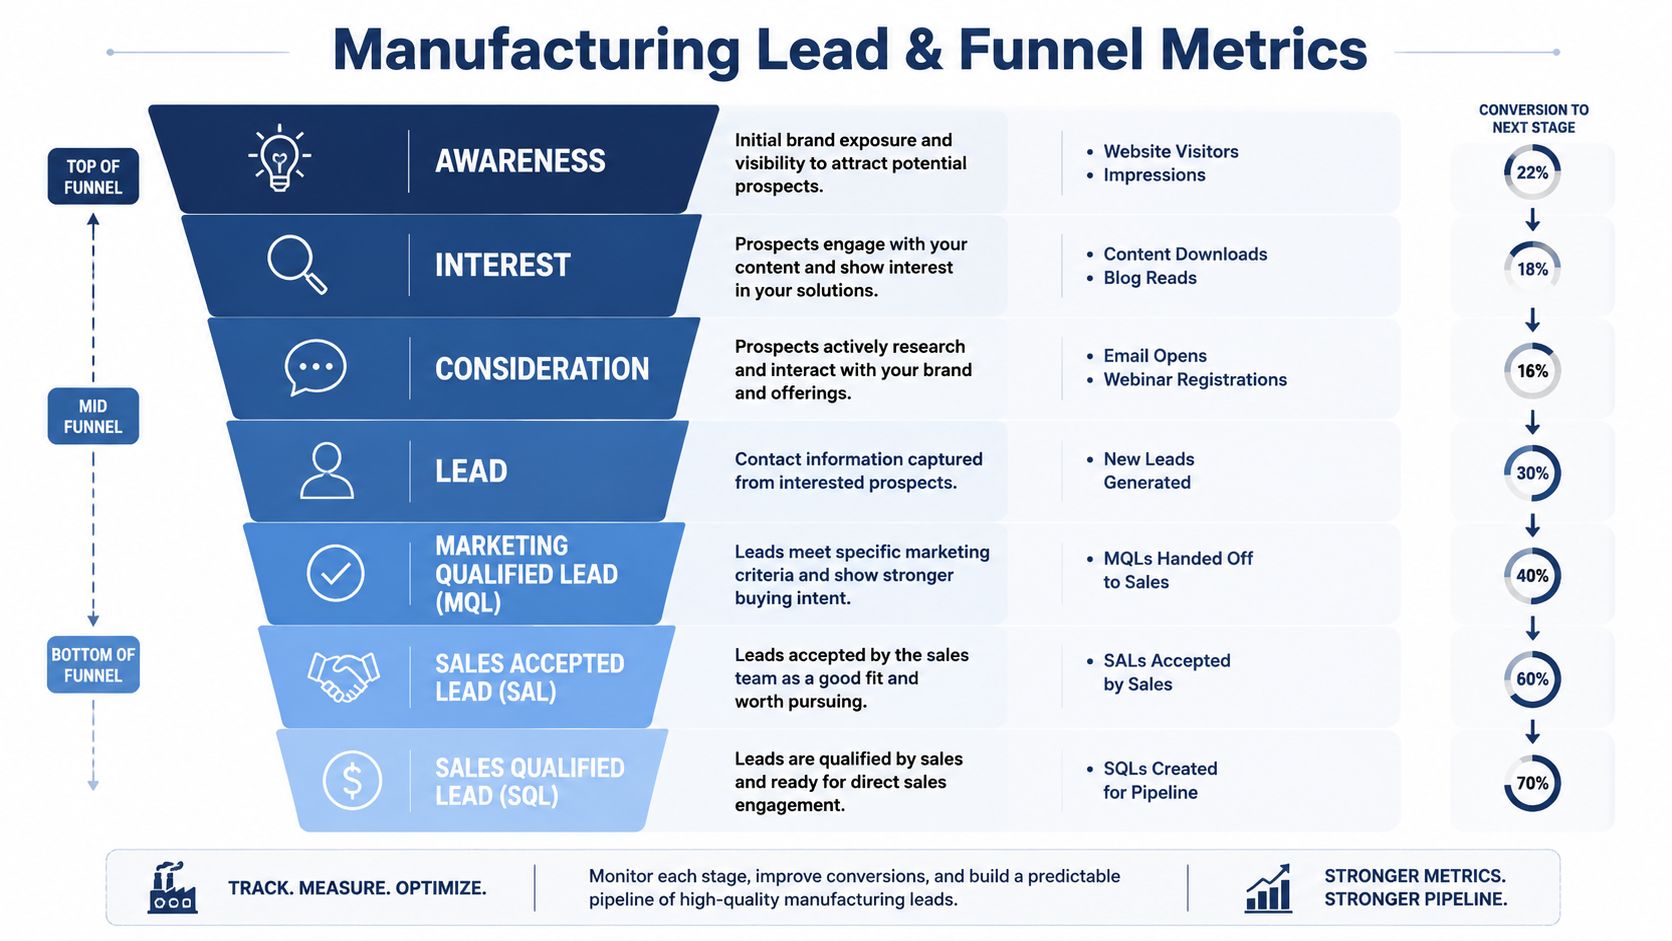
A clean pipeline view starts with agreed definitions.
- Lead means a new identifiable contact or account-level inquiry.
- MQL means marketing believes the contact fits your targeting and has shown enough intent or relevance to merit sales review.
- SAL means sales accepted the lead for follow-up.
- SQL means sales confirmed real potential and active qualification.
- Opportunity means a legitimate deal is now in process.
The metric many teams skip is the one that exposes the truth: MQL-to-SQL. If that number is weak, don't jump straight to “marketing is generating bad leads.” The actual issue might be one of several things:
- Loose MQL criteria that count low-intent contacts
- Slow sales follow-up that lets interest cool
- Bad fit targeting in paid or organic acquisition
- Poor routing where leads land with the wrong rep or business unit
- Missing context such as source, content consumed, product interest, or account history
Pipeline tracking becomes diagnostic instead of decorative.
What to look for in the handoff
The most technically useful manufacturing KPIs are the ones that connect campaign activity to stage progression. Tracking lead-to-opportunity conversion rate and pipeline contribution by source helps isolate which channels are producing qualified demand instead of just clicks, and it requires CRM workflows that tag every lead by source and follow it through to revenue, as outlined in this manufacturing pipeline measurement reference.
Here's how that plays out in practice.
A paid search campaign may produce fewer leads than an industry webinar. On the surface, the webinar looks better. But if paid search produces a higher rate of accepted leads and more opportunities inside target accounts, it may be the stronger channel. Without stage progression, both channels get judged by top-of-funnel volume, which is the wrong test.
Sales acceptance is not a courtesy checkpoint. It's a stress test for your targeting, your messaging, and your lead definition.
A useful review cadence looks at more than counts. It asks:
| Stage question | Why it matters |
|---|---|
| Are MQLs being accepted by sales? | Tests lead quality and alignment |
| Are accepted leads becoming SQLs? | Tests follow-up quality and fit |
| Are SQLs converting to opportunities? | Tests whether the demand is real |
| Which sources produce opportunities fastest? | Reveals momentum and efficiency |
| Which sources stall after handoff? | Exposes wasted spend |
If you only track leads created, you're managing a contact database. If you track stage conversion, you're managing a revenue system.
Connecting Digital Efforts to Bottom-Line Revenue
A CEO reviews the monthly dashboard and sees strong traffic, lower cost per click, and more form fills. Then the quarter closes light because the plant still has unused capacity and sales did not get enough winnable opportunities. That gap is the problem this section solves.
Digital metrics matter only if they explain revenue movement. For manufacturers, that means tying channel performance to deal quality, margin, and sales cycle reality. A campaign that generates cheap leads for low-fit shops, students, or small buyers is not efficient. It is waste.
The useful model is a chain of cause and effect. Spend produces visits. Visits produce inquiries. Inquiries produce sales conversations. Sales conversations produce quotes, opportunities, booked revenue, and eventually profitable customers. If one link weakens, the earlier metrics lose meaning.
Build the revenue chain
Start with the operational question. Where does money leak?
A paid campaign can post a healthy CTR and still fail the business if the clicks come from people who will never request a quote, pass technical review, or meet minimum order economics. A landing page can convert well and still hurt revenue if the offer attracts the wrong type of buyer. Marketing teams that stop at platform metrics miss that distinction.
Use the chain below to diagnose the failure point:
- High CTR, low lead conversion rate points to weak page-message match, poor offer structure, or irrelevant traffic.
- Low CPC, weak MQL-to-SQL rate points to inexpensive traffic that does not fit your ICP.
- Strong lead volume, weak opportunity creation points to loose qualification or poor handoff criteria.
- Healthy opportunity volume, poor CAC payback or low profitability points to the wrong account mix, small deal sizes, or too much sales effort per win.
Manufacturing firms require more discipline than generic B2B teams. Revenue is shaped by quoting effort, engineering review, plant constraints, minimum run sizes, distributor involvement, and long replacement cycles. If your KPI set ignores those realities, marketing gets credit for activity instead of contribution.
For leadership teams trying to calculate marketing profitability, the priority is not more dashboard widgets. The priority is a measurement chain that shows which spend creates revenue you want more of.
Key Manufacturing Marketing KPIs and Formulas
| KPI | Calculation | What It Measures |
|---|---|---|
| CPC | Ad spend / clicks | Cost efficiency of traffic acquisition |
| CPM | Ad spend / impressions | Cost to gain visibility |
| CTR | Clicks / impressions | Message relevance to the audience |
| Lead conversion rate | Leads / visits or clicks | Ability to turn attention into inquiries |
| MQL-to-SQL rate | SQLs / MQLs | Lead quality and sales acceptance |
| SQL-to-close rate | Closed customers / SQLs | Win rate on qualified demand |
| CAC | Total acquisition cost / new customers | Cost to win a customer |
| CLTV | Customer value over relationship lifespan | Economic value of the customer relationship |
| Marketing-sourced revenue | Revenue from marketing-originated deals | Direct revenue contribution from marketing |
| ROMI | Return generated relative to marketing investment | Financial return on spend |
The table matters less than the relationships between the numbers. CPC without SQL quality can push you toward cheap underperforming channels. CLTV without CAC can justify campaigns that take too long to pay back. Marketing-sourced revenue without margin context can overstate success in product lines that are expensive to service.
A better review asks harder questions. Which channels create opportunities in target segments? Which campaigns produce deals that fit plant economics? Which sources shorten time to quote, improve win rate, or bring in repeatable account types? That is how digital effort connects to the bottom line.
If you need a working model for tying spend, attribution, and closed revenue together, use this guide to measure marketing ROI across the full revenue path.
How to Build Your Marketing Measurement System
A KPI framework is only useful if your data survives contact with reality.
Most manufacturers already have pieces of the system. Website analytics, ad platforms, CRM records, email automation, trade show scans, and sales notes all exist somewhere. The problem is fragmentation. One team owns traffic data. Another owns lead records. Sales owns opportunities. Operations owns fulfillment reality. Nobody owns the full chain.
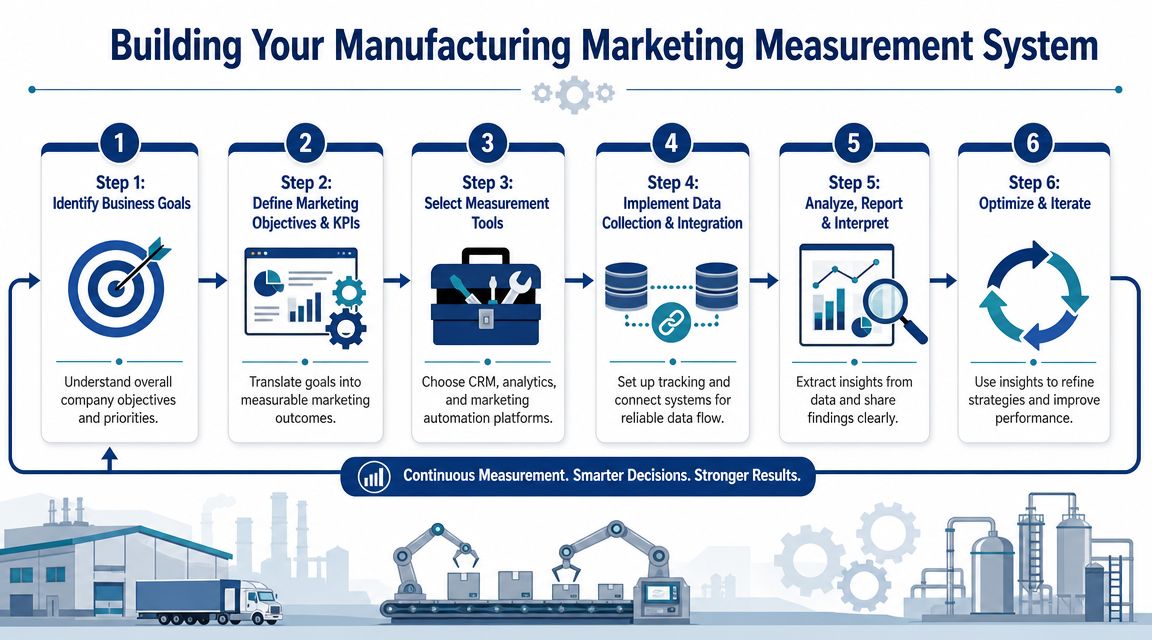
Audit before you automate
Before adding dashboards, audit the data path.
Start with a worksheet and map these sources:
- Website analytics for visits, landing pages, and form conversions
- Ad platforms for CPC, CPM, CTR, spend, and campaign identifiers
- CRM for leads, owners, stages, opportunities, and revenue outcomes
- Marketing automation for email engagement, nurture flows, and source capture
- Offline inputs such as trade shows, distributor referrals, inbound calls, and rep-entered leads
Then ask three hard questions:
- Where does lead source get assigned?
- Where does stage progression get recorded?
- Where does closed revenue connect back to the originating source?
If any answer relies on manual memory, the data will degrade.
The system architecture that actually works
The practical model is straightforward.
Your CRM is the system of record. Salesforce works. HubSpot works. GoHighLevel can work for smaller teams. Machine Marketing's marketing analytics work also sits in this category of implementation support, where the main job is tying tracking, CRM structure, and reporting into one operating system.
Build around these rules:
- Every lead gets a source tag at creation. Don't leave this for sales to fill in later.
- Every stage has a clear entry definition. If MQL and SQL are fuzzy, the dashboard becomes political.
- Every rejection has a reason code. Not a fit, no budget, wrong geography, bad timing, duplicate, existing account.
- Every opportunity keeps the original source visible. Revenue must remain traceable.
A helpful reference for structuring campaign reporting and interpretation is Rebus's campaign effectiveness guide. It's useful because it reinforces the need to connect campaign performance to decisions, not just reporting output.
The dashboard should answer two things fast. Where is the bottleneck, and where should the next dollar go?
What your dashboard should show leadership
Don't overload the first dashboard. Use a tight set of decision metrics:
- Source-level lead volume
- MQL-to-SQL and lead-to-opportunity conversion
- Pipeline contribution by source
- Marketing-sourced revenue
- CAC and profitability view
- Open rejection reasons
- Operational constraints that affect deliverability
That last item matters more than most marketing teams admit. If demand increases in a product line with tight capacity or unstable delivery performance, the dashboard should surface that risk before campaign spend scales.
Common KPI Mistakes and How to Correct Them
Most KPI mistakes aren't math problems. They're framing problems.
Teams collect data, but they interpret it through the wrong lens. They give too much credit to the first touch, celebrate lead volume without checking conversion quality, or spread attention across so many metrics that nobody can decide what to do next.
Five errors that distort decision-making
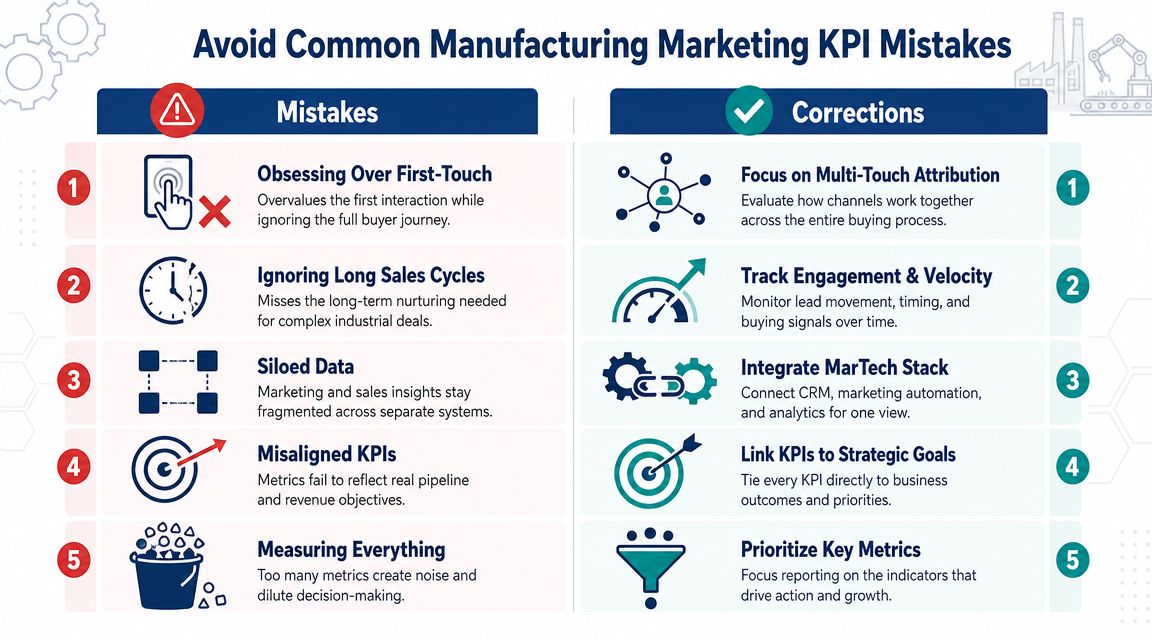
Here are the most common ones we see.
- Overvaluing first-touch attribution. Industrial buyers often have multiple interactions before sales engagement. If you only credit the first click, you'll underweight nurturing, branded search, email, and sales-assisted channels.
- Ignoring the denominator. More leads is not good news if conversion quality falls. Raw volume without stage conversion hides waste.
- Running siloed systems. When marketing automation, CRM, and revenue data don't align, every meeting turns into a data argument.
- Tracking too many KPIs. If leadership sees twenty metrics and none tie to decisions, the dashboard has failed.
- Setting KPI targets without process discipline. A KPI can't rescue slow follow-up, weak messaging, or bad lead routing.
Why operations belongs in the KPI conversation
This is the underrated part of marketing KPIs for manufacturing.
A strong demand program can fail if production capacity, lead times, or on-time delivery can't support the demand being generated. Recent manufacturing-focused analysis argues that marketing should watch MQL-to-SQL acceptance, production attainment, and capacity utilization to avoid over-promising, because buyers increasingly care about responsiveness and reliability. That perspective is captured in Gushwork's analysis of manufacturing marketing metrics.
That means your KPI model shouldn't stop at “can we generate demand?” It should ask “can we generate the right demand, at the right pace, for what the business can deliver profitably?”
A booked order isn't always a successful marketing outcome if the plant can't support the promise behind it.
The correction is simple in principle, harder in discipline:
| Mistake | Correction |
|---|---|
| Measuring channel activity in isolation | Tie channels to stage progression and revenue |
| Judging marketing on leads alone | Add acceptance, opportunity, and contribution metrics |
| Treating marketing as separate from operations | Include capacity and delivery reality in planning |
| Reporting every metric available | Keep only metrics tied to decisions |
| Hiding rejection reasons | Use them to improve targeting and handoff rules |
A mature marketing system doesn't just create demand. It creates deliverable demand.
Your First 90-Day KPI Implementation Plan
You don't need a perfect dashboard in week one. You need a working system that gets cleaner each month.
Days 1 to 30
Start with definitions and data hygiene.
- Define stages clearly. Agree on lead, MQL, SAL, SQL, and opportunity with sales.
- Audit source tracking. Make sure every inbound path captures a usable source value.
- List current tools. Website analytics, CRM, ad platforms, marketing automation, offline lead sources.
- Choose the core KPI set. Keep it tight: source, stage conversion, pipeline contribution, revenue contribution, CAC view.
Questions to ask:
- Are sales and marketing using the same lead definitions?
- Can we identify where each lead came from?
- Can we see which leads became opportunities?
Days 31 to 60
Build the reporting flow.
- Connect source data to CRM records.
- Add rejection reasons so sales feedback becomes measurable.
- Create a simple dashboard for leadership and a more detailed one for the marketing team.
- Review stage leakage weekly instead of waiting for monthly summaries.
Questions to ask:
- Which channels are producing accepted leads?
- Where are leads stalling?
- Which campaigns create pipeline, not just inquiries?
Days 61 to 90
Start optimizing with evidence.
- Reduce spend on channels that create activity without progression.
- Refine MQL criteria if sales keeps rejecting leads.
- Compare demand plans with operational capacity before pushing harder on promotion.
- Document the reporting SOP so the system survives team changes.
Questions to ask:
- Which source deserves more budget?
- Which handoff rule needs fixing?
- Are we generating demand the business can fulfill well?
The first move is simple. Pick one reporting period, trace every lead source into CRM, and measure how many became real opportunities. Once you can do that reliably, the rest of the KPI system starts to behave like an engineered process instead of a collection of marketing screenshots.
If you want help diagnosing your current setup, Machine Marketing works with manufacturers and industrial businesses to connect CRM, tracking, and reporting into a usable growth system. If your reports look active but don't explain revenue, start there.