
Most retention advice starts with the wrong question: “How do we keep customers satisfied?” Satisfaction matters, but it's often a lagging signal. A manufacturer can receive positive feedback and still lose the next order because a drawing was approved late, a quote took too long, or the first invoice contained an error.
Understanding customer retention in industrial B2B means tracing the operational events that lead to a second order, a renewed service agreement, a replacement-parts purchase, or a larger share of the customer's spend. We'll look at retention as an engineered system, not a vague customer-service objective.
Table of Contents
- The Real Financial Impact of Keeping Your Customers
- Why SaaS Metrics Fail in Industrial B2B
- Distinguishing Inactivity from True Churn
- The Critical First 90 Days After Sale
- Building an Early-Warning Account Health System
- Next Steps for Measuring and Improving Retention
The Real Financial Impact of Keeping Your Customers
Retention isn't just the practice of preventing cancellations. For a manufacturer, it means keeping customers active, protecting repeat production work, renewing maintenance contracts, increasing order frequency, and finding expansion opportunities inside accounts you've already won.
That distinction changes how you allocate resources. A new industrial customer may require months of sales effort, technical qualification, quoting, site visits, engineering review, onboarding, and internal coordination before the first profitable order arrives. An existing customer already understands your capabilities and has some level of trust in your delivery process.
The commonly cited benchmark is that acquiring a new customer generally costs between five and twenty-five times more than retaining an existing one, although the exact multiple varies by industry and study. The underlying retention-cost discussion treats that range as a directional benchmark, not a universal accounting rule.
Retention protects work you've already paid for
Your acquisition cost doesn't end when a prospect signs a quote. It includes sales labor, estimating, travel, trade shows, advertising, engineering support, onboarding, and the time your operations team spends getting the relationship working.
If the customer disappears after one order, you may not recover that investment. If the customer returns for another production run or renews a service contract, the original acquisition expense supports more revenue without requiring the same level of trust-building and technical education.
Practical rule: Calculate retention economics using your own acquisition cost, retention cost, gross margin, renewal rate, and customer lifetime value. Treat industry benchmarks as prompts for analysis, not as targets.
This is particularly important for industrial companies with complex offers. A repeat order for replacement components, a blanket purchase order, an engineering change, or a scheduled maintenance visit may carry very different margins and service requirements. Retaining the account matters, but retaining the profitable part of the account matters more.
Profitability improves when avoidable defections fall
Foundational research by Frederick Reichheld and W. Earl Sasser reported that reducing customer defections by 5% increased profits by roughly 25% to 85% across the companies examined. The results differed by sector, including 85% in one bank-branch system, 50% in an insurance brokerage, and 30% in an automobile-service chain. The historical findings and their limitations are summarized here.
Those results aren't a guarantee for your shop. They do show why retention deserves financial attention. A retained customer can continue buying while requiring less education and selling effort than a new account. The customer may also expand into additional services, although that outcome depends on your business model.
For a practical perspective on how connected industrial products can support profitability and account value, review Faberwork LLC on smart controllers. The larger lesson is that retention becomes stronger when you keep solving useful operational problems, not when you merely send more promotional messages.
Measure retention by account, cohort, contract type, order type, and gross margin. Total annual sales can hide the loss of a strategically important customer or product line. A financial control point gives you a better question than “How many accounts did we keep?” Ask, “Which profitable relationships are becoming repeatable, and where are we losing value before the next order?”
Why SaaS Metrics Fail in Industrial B2B
Monthly churn is useful when customers make a recurring decision every month. It becomes misleading when applied to a machine shop whose customers order around production schedules, project awards, inventory requirements, or maintenance shutdowns.
A software customer who hasn't logged in for a month may be at risk. An industrial buyer who hasn't ordered for a month may be following a completely normal purchasing cycle. A customer can also place one large order, pause while that inventory is consumed, and return later without ever becoming disloyal.

The denominator changes the meaning
Subscription businesses often report average monthly churn of 5.3%, average annual retention of 72%, and annual retention of 90% or more for high-performing subscription companies. Those benchmarks provide a framework for recurring industrial offers such as monitoring software, consumables programs, and maintenance agreements, but they aren't universal manufacturing targets. The subscription retention benchmark source explains the distinction.
The critical issue is what you're counting:
| Measure | What it tells you | Industrial limitation |
|---|---|---|
| Logo retention | Whether customer accounts remain active | Treats a small account and a major account as equivalent |
| Order retention | Whether customers place another order | Can miss long but normal reorder intervals |
| Revenue retention | How much existing revenue remains | Can hide operational issues inside individual product lines |
| Net revenue retention | Existing revenue plus expansion, minus losses | Requires reliable account and revenue classification |
A manufacturer might retain 95% of customer accounts while losing a strategically important high-margin account. That example is a measurement warning, not a benchmark. You need to track customer count and revenue separately, then examine product category, application, buying cadence, and account concentration.
Separate voluntary loss from administrative loss
B2B SaaS benchmarks also distinguish average monthly churn of 3.5%, made up of approximately 2.6% voluntary churn and 0.8% involuntary churn. The churn taxonomy discussion shows why every lost customer shouldn't be treated as evidence of poor product value.
Industrial companies can apply the same diagnostic logic without copying the SaaS formula. A lost account might reflect a competitor, a failed project, a quality issue, a pricing decision, nonpayment, an expired contract, an internal purchasing change, or an administrative mistake.
Create a loss taxonomy and require a reason for every lost account. Then compare the stated reason with delivery performance, quote response time, unresolved service issues, and order history. That process turns churn from a headline number into a troubleshooting queue.
A 2025 survey of 263 North American industrial buyers found that 77% had obtained a price or lead-time quote through a supplier's digital tool without speaking with sales. The industrial buyer research highlights a practical risk: a customer can begin disengaging through digital behavior before a salesperson sees an obvious warning.
Distinguishing Inactivity from True Churn
A quiet account isn't automatically a lost account. The first job is to define what normal inactivity looks like for each product category, customer type, and buying pattern.
A distributor buying standard replacement parts may reorder frequently. A machine builder may place an order only when a project reaches a specific design or production stage. A contract manufacturer may order in batches tied to its customer's forecast. One inactivity threshold cannot serve all three.
Build thresholds from actual buying cadence
Start with your order history and classify customers by how they buy. You don't need a complex predictive model to begin. You need a consistent operating definition that sales, service, and finance can use.
Use this diagnostic sequence:
- Group by offer and application. Separate repeat production, spare parts, engineering work, maintenance, and project-based orders.
- Review reorder intervals. Identify the normal time between orders for each group instead of applying one calendar rule to every account.
- Mark the expected next event. Record when the next quote, maintenance visit, production release, forecast, or replenishment decision should occur.
- Flag deviation from the pattern. A customer becomes a risk signal when inactivity exceeds its normal range or when another expected event fails.
- Check operational evidence. Compare the gap with open quotes, unresolved quality issues, delivery problems, service tickets, and website or portal activity.
- Assign a human action. Decide whether the account needs a useful check-in, a technical answer, a quote review, or a recovery conversation.
Don't call an account churned because the calendar is quiet. Call it at risk when the customer's expected buying event has passed and the evidence points to friction, replacement, or disengagement.
Track revenue, not just account status
Account-level retention can look healthy while revenue retention weakens. Track gross revenue retention, lost-account revenue, reorder intervals, share of wallet, and cohort retention by acquisition source and customer type.
Gross revenue retention focuses on the revenue that remains from existing customers, excluding expansion. It helps answer whether your current base is holding its value before upsells and new business make the results look better.
For each account, maintain a simple status:
- Active: Buying within the expected cadence, with no unresolved milestone or service issue.
- Dormant: No recent order or quote activity, but the account remains plausibly recoverable.
- At risk: A normal buying event has slipped, or operational evidence indicates dissatisfaction or replacement.
- Lost: The customer has confirmed a switch, cancellation, project closure, or other clear exit reason.
That classification prevents two expensive mistakes. You won't waste sales time chasing an account that has a normal project pause, and you won't ignore a valuable customer whose silence follows a missed delivery or unresolved specification problem.
A customer-health review should ask: What was supposed to happen next, did it happen, and who owns the next action? That question is more useful than a generic churn percentage.
The Critical First 90 Days After Sale
A complex industrial sale can fail after the contract is signed. The customer may still be evaluating whether your team can deliver documentation, approve specifications, meet response commitments, and make the first production experience dependable.
Recent B2B research reports that 43% of churn occurs within the first 90 days, linking early losses to onboarding gaps, communication breakdowns, and fragmented digital experiences. The source and its sector limitation are explained in this B2B retention research. It covers multiple B2B sectors rather than manufacturing specifically, but the operational implication is highly relevant to machine builders, contract manufacturers, and industrial service firms.
Consider a new customer placing an initial order for a specialized component. The sales team may view the signed quote as the finish line. The customer sees it as the start of a chain of dependencies.
Stage one starts with technical confidence
The first milestone is not a satisfaction survey. It's the delivery and acceptance of the information the customer needs to proceed.
Confirm that your team has completed:
- Technical documents and certifications
- Drawings, specifications, and revision records
- Commercial terms and delivery expectations
- A named operational contact
- Clear escalation instructions for quality or schedule issues
If a drawing approval is delayed, the account owner should know immediately. Don't wait for the customer to complain. A missed technical milestone can move production, frustrate the buyer, and make a competitor look easier to work with.
Stage two proves execution
For a production order, first-article acceptance is a critical proof point. The customer needs evidence that the part, assembly, or process meets the agreed specification before confidence can develop.
Track the operational milestones that matter to the offer:
- Drawing or specification approval
- First-article submission and acceptance
- Installation or implementation completion
- Response-time adherence
- First successful production run
- Invoice accuracy
- Scheduled reorder or maintenance planning
These events give your team an objective view of retention progress. A customer may say the relationship is going well while an incorrect invoice remains unpaid or a service issue sits unresolved. Satisfaction can lag behind the operational problem.
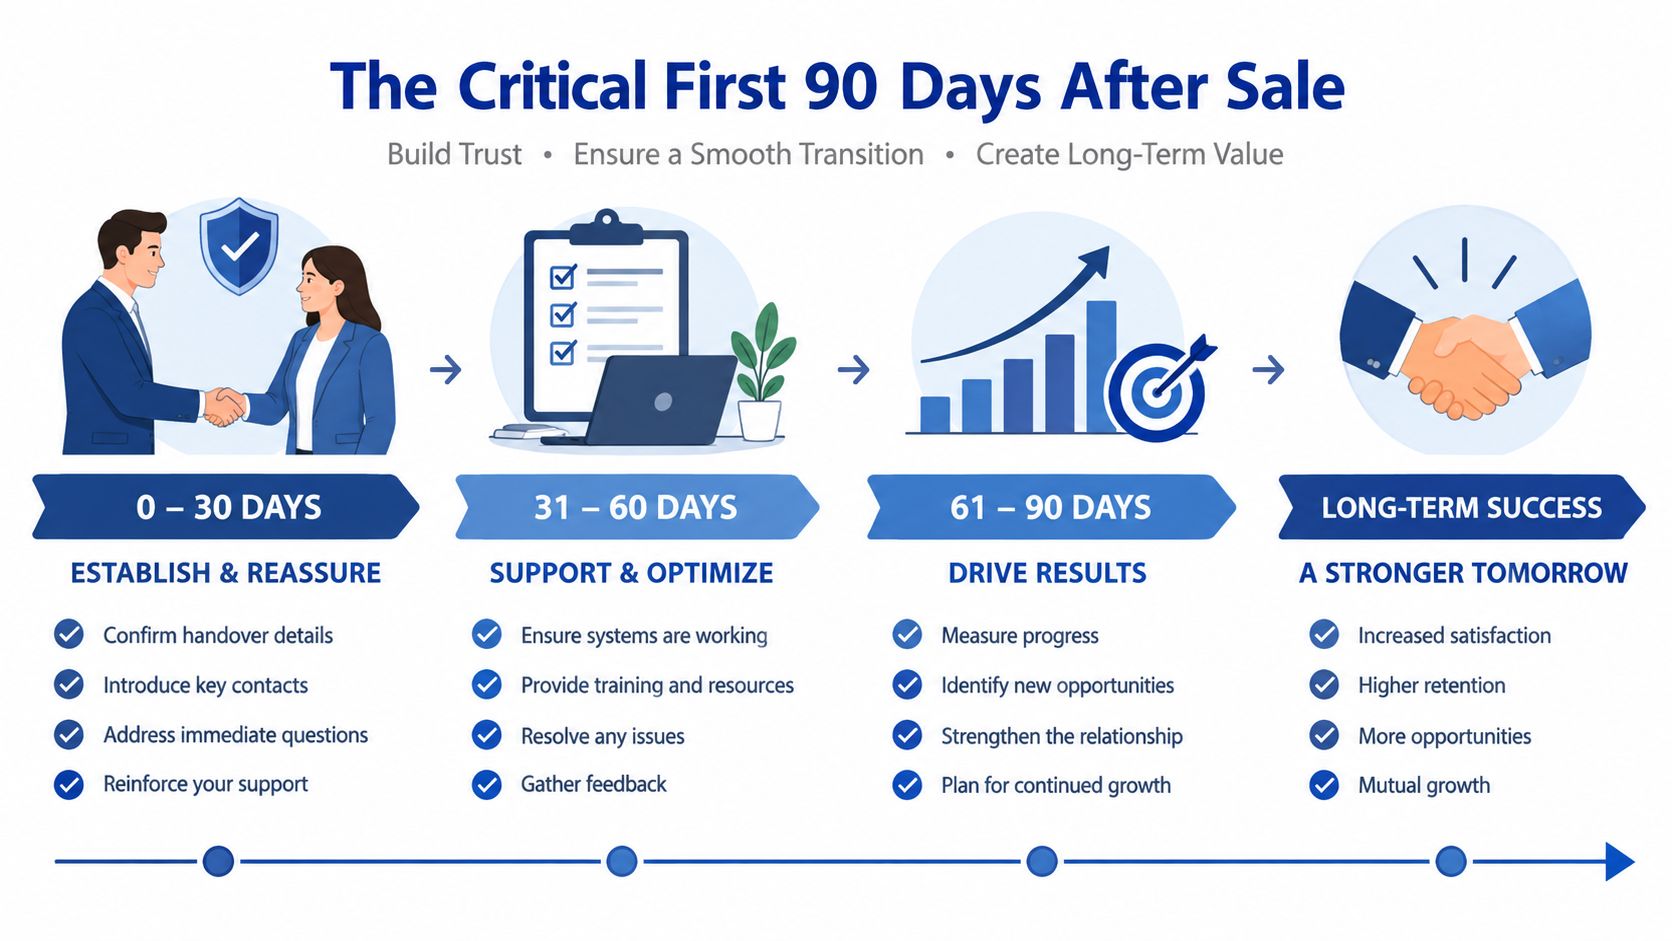
Stage three makes the second order easier
The first order proves capability. The second order proves that working with you has become repeatable.
Before the initial job closes, ask what the customer will need next. Is the next purchase driven by production consumption, scheduled maintenance, a project milestone, or inventory planning? Put that expected event into the CRM and create an owner.
A useful first-90-day review should include:
| Review question | Evidence to inspect |
|---|---|
| Did the customer receive the right information? | Document delivery and approval records |
| Did the first job meet expectations? | Quality acceptance, delivery, and service data |
| Did communication remain clear? | CRM activity and escalation history |
| Is the next buying event visible? | Forecast, reorder plan, or maintenance schedule |
| Has finance created friction? | Invoice accuracy and payment status |
The strongest retention programs don't ask the customer to manage this process alone. They give sales, engineering, service, fulfillment, and finance shared milestones with clear owners.
Building an Early-Warning Account Health System
An account-health system should combine evidence from the places where customer intent appears. CRM notes alone won't show the full picture. Order history alone won't explain why a customer stopped buying.
Bring together CRM activity, quote behavior, website engagement, service issues, fulfillment records, and order history. The system doesn't need to produce a mysterious score that nobody trusts. It needs to show what changed, why it matters, and who should respond.
Use signals with operational meaning
A useful health model distinguishes between normal variation and a broken customer journey. For example, a lower order frequency may reflect seasonal production, while a lower order frequency combined with an unanswered quote and a late service resolution deserves immediate attention.
Create signal categories such as:
- Commercial: Fewer quote requests, declining quote acceptance, or an open quote with no decision.
- Operational: Late delivery, repeat quality issue, missed installation date, or incomplete first-article approval.
- Financial: Invoice dispute, payment delay, incorrect purchase-order details, or contract renewal approaching.
- Engagement: Reduced portal activity, fewer technical-document downloads, or a dormant contact record.
- Relationship: No recent account review, departure of a key contact, or unassigned escalation.
Don't treat every signal as equal. A website visit is weak evidence on its own. A missed production milestone followed by silence is much stronger. Your team should define which combinations trigger a human review.
Trigger intervention, not just reporting
A dashboard that turns accounts red without a response process becomes another ignored report. Every warning needs an owner, a deadline, and a prescribed first action.
For example:
- The system identifies an overdue quote and a slipping reorder date.
- The account owner checks whether pricing, lead time, specification, or purchasing approval caused the delay.
- Engineering or operations joins the response if the issue isn't commercial.
- The customer receives a useful update, not a generic “just checking in” message.
- The owner records the reason and next expected event.
- The account returns to monitoring only after the event is resolved.
A conversational tool such as the Expressify AI chat tool can help capture questions and route routine inquiries, but automation shouldn't replace judgment on high-value technical or service issues. Customers need a fast path to a person who understands the account when the problem involves specifications, quality, delivery, or production risk.
Connect the system to your CRM
Your CRM should hold the customer's commercial and operational story in one place. If sales sees the quote, service sees the ticket, and operations sees the delivery issue in separate systems, nobody owns the complete retention risk.
Review CRM systems for manufacturing companies with a focus on practical workflow requirements:
- Account and contact roles
- Quote and opportunity stages
- Expected reorder or renewal dates
- Service and quality issues
- Milestone completion
- Lost-account reasons
- Follow-up ownership
- Reactivation status
Use automation for reminders, data movement, and routine follow-up. Keep escalation decisions with people. The objective isn't to send more messages. It's to prevent a known operational problem from becoming a customer's reason to leave.
Next Steps for Measuring and Improving Retention
Start with a clean customer segmentation. Export your current accounts and classify them as active, dormant, or lost. Then calculate revenue and gross margin for each group, rather than relying on the number of logos alone.
Next, review the events that preceded inactivity. Look for late quotes, unresolved service issues, invoice disputes, missed maintenance reminders, and lost contacts. You're looking for a repeatable failure pattern that the team can correct.
Compare reactive and proactive work
Reactive support is necessary, but it starts after the customer experiences friction. Proactive retention begins earlier by monitoring expected milestones and contacting the account before the problem becomes a complaint.
| Reactive approach | Proactive approach |
|---|---|
| Respond when a customer reports a problem | Monitor delivery, quote, and service milestones |
| Measure tickets closed | Measure successful operational outcomes |
| Ask why the customer left | Identify risk before the next order is missed |
| Send broad reactivation messages | Segment dormant accounts by reason and value |
| Focus on satisfaction scores | Connect feedback with behavior and margin |
Test one retention lever at a time where possible. Compare faster quote follow-up, scheduled maintenance reminders, technical training, executive reviews, or dormant-account reactivation against the behavior you want, such as a repeat order, renewal, or profitable expansion.
For recurring industrial offers, customer retention metrics from Chartsy can help clarify the difference between logo retention, churn, and revenue retention. Use the framework carefully, then adapt the definitions to your contract terms and purchasing cycles.
The practical sequence is simple:
- Define active status by customer type.
- Segment accounts by cadence, revenue, and margin.
- Record the next expected buying or service event.
- Create milestone alerts and named owners.
- Review lost-account reasons every month.
- Run targeted recovery or expansion actions.
- Compare results by cohort and account type.
For a broader operating plan, use this guide on how to improve customer retention. Retention improves when your marketing, sales, service, and operations teams act from the same account information.
Machine Marketing helps manufacturers connect CRM, follow-up campaigns, re-engagement, and industrial marketing strategy into a retention system built around real customer milestones. Visit Machine Marketing to request a practical diagnosis of where accounts go quiet and which operational signals your team should act on first.
