Most advice about B2B lead generation KPIs tells you to celebrate more leads, more MQLs, and a lower CPL. That advice is incomplete, and for manufacturers with technical products and long sales cycles, it can actively send your team in the wrong direction.
A dashboard full of cheap leads can still produce an empty pipeline. We need to measure what happens after capture, how quickly sales responds, which accounts are engaging, and whether opportunities progress toward revenue. The framework below replaces activity reporting with a working diagnosis of pipeline performance.
Table of Contents
- Why Most B2B Lead Generation Dashboards Lie to You
- The Core B2B Lead Generation KPIs You Should Track
- Reading the Funnel Stage by Stage
- Channel-Level Conversion Rates That Change the Conversation
- Account-Level and Speed-to-Lead Metrics for Modern Buying Groups
- Building the KPI Dashboard in Your CRM
- Your 30-60-90 Day KPI Rollout Plan
Why Most B2B Lead Generation Dashboards Lie to You
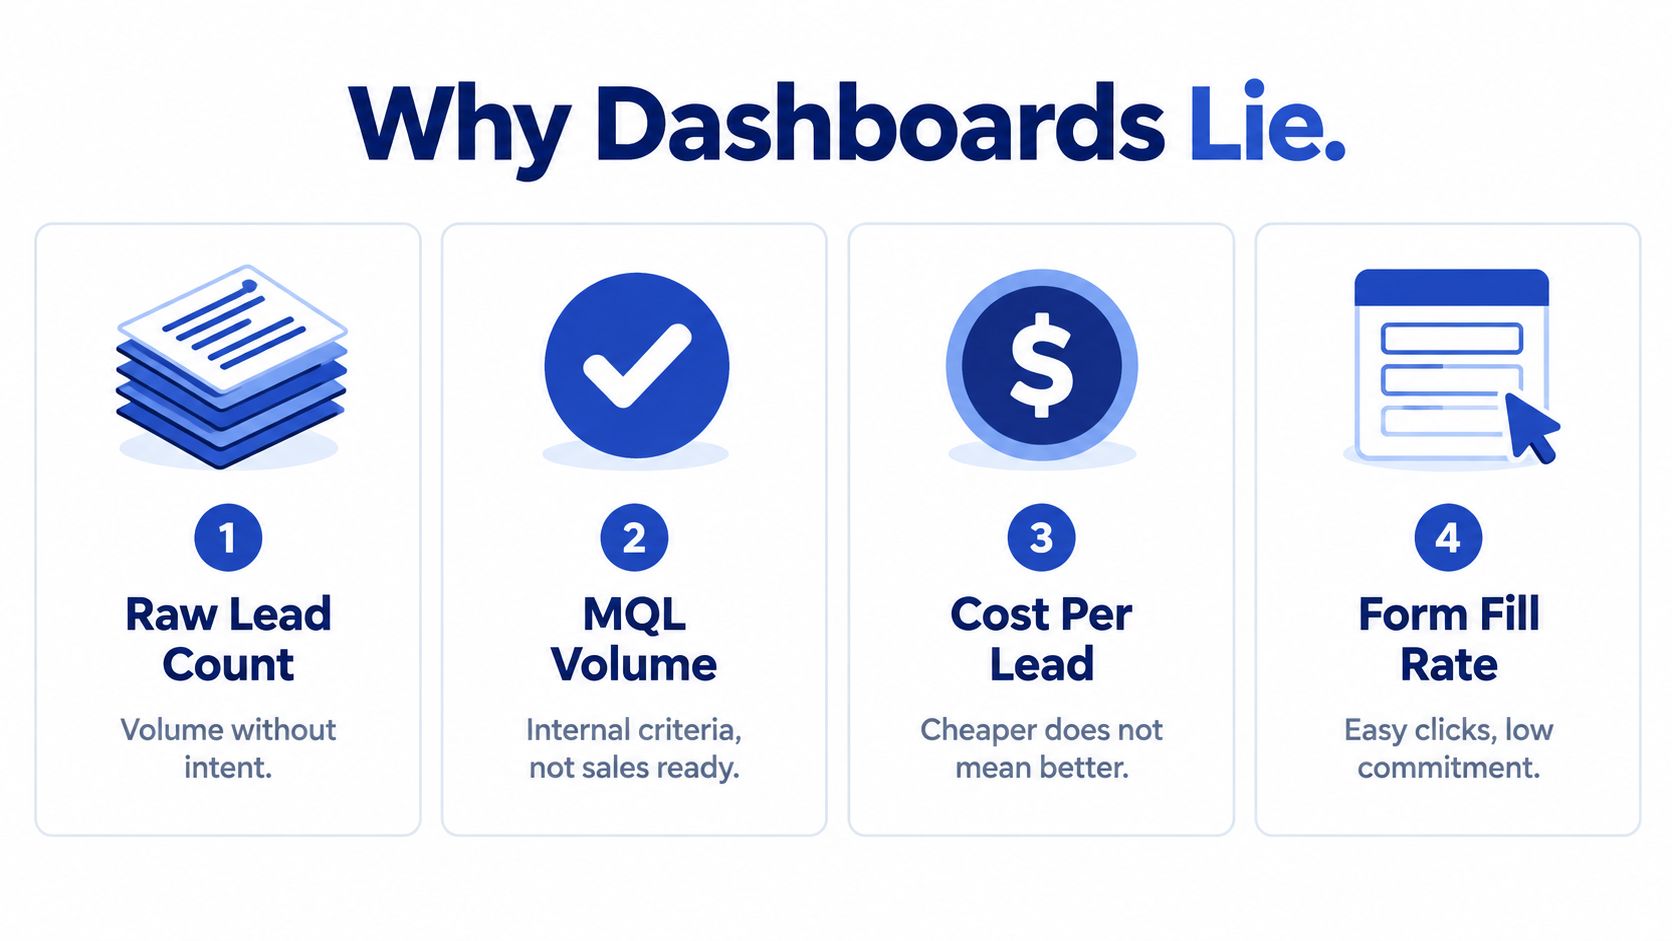
Your dashboard probably reports raw lead count, MQL volume, cost per lead, and form-fill rate. Those numbers are easy to calculate, easy to present, and often disconnected from the question your sales director really cares about: Which accounts can become real opportunities?
Raw lead count measures volume without intent. A manufacturer can attract students, suppliers, job seekers, competitors, and companies outside its service area. None of those contacts should carry the same weight as an engineering manager from a target account who has reviewed a technical page and requested a conversation.
MQL volume creates a second problem. Marketing defines the threshold, then reports success when contacts cross it. Sales may receive a list of people who downloaded a general guide but have no project, authority, budget, or timeline. A larger MQL number can therefore hide declining sales acceptance.
CPL is useful for controlling acquisition efficiency, but it doesn't measure commercial value. A low-cost lead from an irrelevant audience is more expensive than a higher-cost lead that becomes a qualified opportunity. Form-fill rate has the same weakness. A short form may increase submissions while reducing the information needed for routing and qualification.
The numbers that deserve executive attention
The median B2B website conversion rate is 2.9%, with organic search at 2.6%, email at 2.4%, paid search at 1.5%, and paid social at 0.9% in a benchmark covering more than 100 million data points across 14 industries (benchmark coverage of B2B lead generation statistics). Those figures are useful as a comparison point, but they don't tell you whether a captured lead fits your ideal customer profile.
We'd put the following measures above vanity volume:
- MQL-to-SQL rate: Do sales accept the contacts marketing sends?
- SQL-to-opportunity rate: Do accepted leads become genuine buying projects?
- Opportunity-to-customer rate: Does the commercial process produce closed business?
- Speed-to-lead: How long does a qualified inquiry wait for a human response?
- Account engagement: Are multiple people from the same target company active?
- Pipeline contribution: How much qualified pipeline can each source traceably create?
Practical rule: If a metric can't help you decide where to invest, whom to route, or which stage to repair, it doesn't belong on the executive dashboard.
A useful dashboard doesn't eliminate lead volume or CPL. It demotes them. Keep them for operational diagnosis, then connect them to qualification, opportunity creation, and closed-won revenue. That gives you a KPI system built around commercial progress rather than marketing activity.
The Core B2B Lead Generation KPIs You Should Track
Start with a shared spreadsheet or CRM report before buying another analytics tool. Define each metric, assign an owner, and record the date and source for every stage transition. Your team should be able to explain exactly how a number was produced.
| KPI | Formula | Definition |
|---|---|---|
| Lead volume | Count of new leads in the period | The number of new contacts entering your defined funnel |
| MQL-to-SQL conversion rate | SQLs ÷ MQLs × 100 | The share of marketing-qualified contacts accepted by sales |
| SQL-to-opportunity rate | Opportunities ÷ SQLs × 100 | The share of sales-qualified leads that become active commercial opportunities |
| Opportunity-to-customer conversion | Closed-won customers ÷ opportunities × 100 | The proportion of opportunities that become customers |
| Customer acquisition cost | Total sales and marketing cost ÷ new customers | The average cost of acquiring a new customer |
| Customer lifetime value | Average customer value per period × average customer lifespan | The expected commercial value of a customer over the relationship |
| Lead velocity rate | (Current qualified leads − previous qualified leads) ÷ previous qualified leads × 100 | The growth rate of qualified lead creation between comparable periods |
| Channel ROI | Channel-attributed gross profit or revenue ÷ channel cost | The financial return associated with a specific acquisition source |
Define the handoffs before calculating them
A contact becomes an MQL only when it meets an agreed fit and behavior standard. An SQL requires an explicit sales action, such as acceptance, a booked discovery conversation, or another documented qualification event. An opportunity needs a defined commercial condition, not just a salesperson's optimism.
Here, an ICP and qualification framework helps. Use it to document the companies, roles, operational problems, and buying signals that qualify a contact for the next stage. Without those definitions, your conversion rates measure inconsistent judgments.
Track demo requests, form fills, booked meetings, and technical inquiries separately before combining them. A form asking for a product catalogue shouldn't automatically receive the same status as a request for a production consultation.
Your marketing analytics system should preserve the original source, campaign, offer, landing page, account, and stage dates. Otherwise, you won't know whether a weak SQL rate came from poor targeting, slow follow-up, loose qualification, or a broken handoff.
Use financial metrics with discipline
CAC and LTV matter when your data includes the full commercial cost and a meaningful customer history. Don't use them to rank a channel prematurely if the sales cycle hasn't produced enough closed-won outcomes. In that situation, use cost per SQL and cost per opportunity as interim operating measures, then update the financial view as opportunities mature.
LVR is a directional signal, not a revenue forecast by itself. A rising number of qualified leads means little if the qualification standard has weakened or sales capacity can't process the additional demand. Pair it with stage conversion and pipeline creation.
Reading the Funnel Stage by Stage
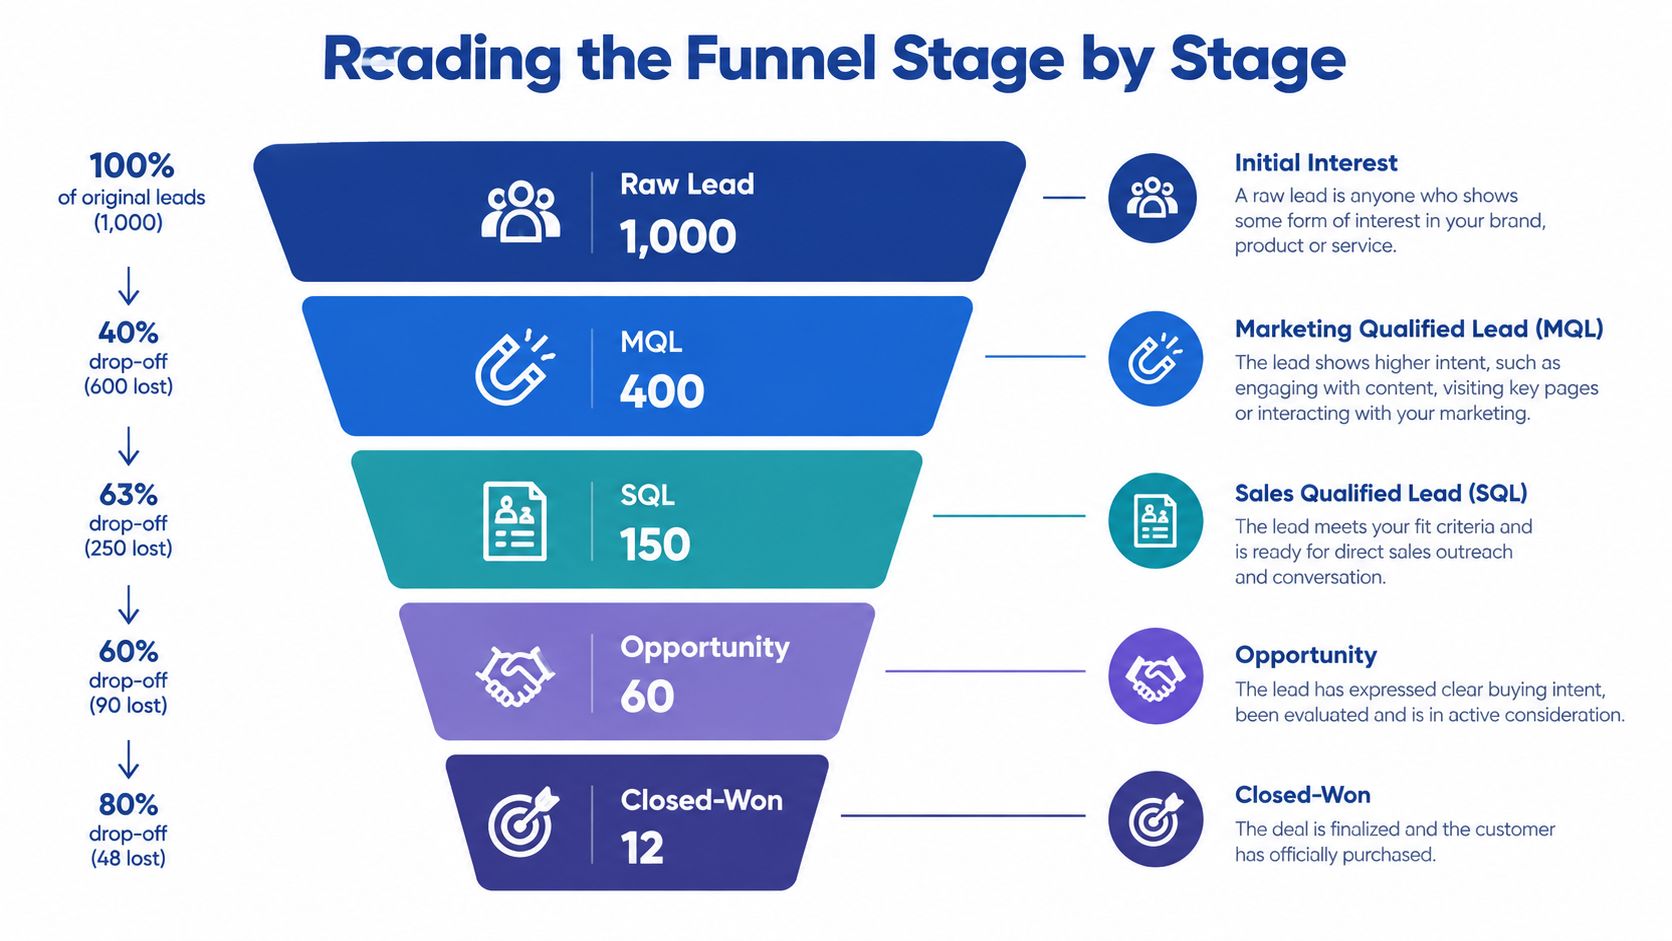
A lead-generation funnel is a chain of handoffs. Each handoff can lose value, so top-of-funnel growth can't compensate for a qualification or closing process that fails later.
A benchmark dataset reports a 0.94% full-funnel average, or roughly one closed-won customer for every 106 captured leads, and shows these stage transitions: Lead to MQL at 28.0%, MQL to SAL at 47.1%, SAL to SQL at 31.7%, SQL to opportunity at 59.3%, and opportunity to closed-won at 21.7% (full-funnel B2B lead generation KPI benchmarks). The exact stages in your CRM may differ, but the diagnostic lesson is clear: apparently healthy individual rates can still compound into a small closed-won result.
Inspect every boundary
Start with the raw lead to MQL transition. If this rate is weak, examine offer relevance, targeting, form quality, and the definition of fit. If it is unusually high but sales rejects most contacts, marketing may have made the MQL threshold too easy.
The MQL-to-SQL boundary tests whether marketing and sales agree about readiness. Benchmark coverage commonly places MQL-to-SQL conversion around 13% to 25%, depending on industry, traffic quality, fit, and follow-up practices (B2B lead generation KPI framework and benchmarks). Treat that range as context, not a universal target.
SQL-to-opportunity reveals whether accepted leads have a real project. A low rate can point to weak discovery, poor routing, unclear qualification, or contacts who were interested but not actively buying. Opportunity-to-customer exposes commercial problems such as pricing, technical objections, procurement delays, or weak sales execution.
Find the first material leak
Don't average away the problem. Segment the funnel by:
- Source: Organic search, email, paid search, paid social, partners, and offline activity
- Offer: Technical guide, consultation, demo, quote request, or product inquiry
- Account type: Target account, existing customer, distributor, or non-fit company
- Sales owner: Acceptance, follow-up, opportunity creation, and close by representative
- Time period: Cohorts based on the date a lead entered the funnel
A strong lead count with poor MQL-to-SQL conversion means you have a qualification or targeting issue. A healthy SQL rate with weak opportunity creation means sales acceptance isn't translating into discovery. A healthy opportunity rate with poor close performance requires a commercial diagnosis, not another lead campaign.
Channel-Level Conversion Rates That Change the Conversation
A blended conversion target is a blunt instrument. It can make a channel with strong intent look average and make a high-volume channel look productive even when sales rejects the output.
The verified benchmark data gives you a starting comparison for visitor-to-lead conversion: organic search at 2.6%, email at 2.4%, paid search at 1.5%, and paid social at 0.9% (B2B marketing KPI benchmark data by channel). Those rates shouldn't become fixed targets for your manufacturer. They should prompt you to separate channel performance instead of reporting one blended site rate.
| Channel | Visitor → Lead | Lead → MQL | MQL → SQL | Cost per SQL |
|---|---|---|---|---|
| Organic search | 2.6% benchmark context | Calculate from CRM | Calculate from CRM | Calculate from spend and SQLs |
| Email nurture | 2.4% benchmark context | Calculate from CRM | Calculate from CRM | Calculate from spend and SQLs |
| Paid search | 1.5% benchmark context | Calculate from CRM | Calculate from CRM | Calculate from spend and SQLs |
| Paid social | 0.9% benchmark context | Calculate from CRM | Calculate from CRM | Calculate from spend and SQLs |
| ABM display | Establish your baseline | Calculate from CRM | Calculate from CRM | Calculate from spend and SQLs |
| Partner referrals | Establish your baseline | Calculate from CRM | Calculate from CRM | Calculate from spend and SQLs |
Build a scorecard that respects intent
Organic search may produce fewer immediate inquiries but attract people researching a technical problem. Email nurture may convert a known audience differently from a first-touch paid campaign. Partner referrals may arrive with strong commercial context but lower measurable website activity. You can't judge all three with the same visitor-to-lead expectation.
Record four layers for every channel:
- Visitor-to-lead: Does the source create a captured response?
- Lead-to-MQL: Does the response fit your ICP and qualification rules?
- MQL-to-SQL: Does sales accept it as actionable?
- Cost per SQL: What did it cost to create a lead sales can work?
Then add opportunity value. A channel that creates fewer SQLs but better-fit industrial projects may deserve more budget than a channel producing many low-value inquiries. Don't allocate spend by click volume. Allocate it by qualified pipeline, sales capacity, and the quality of opportunities that source creates.
For channel execution, use a documented source taxonomy and consistent campaign naming. A guide to B2B lead generation tools can help you evaluate prospecting and enrichment options, but tools won't fix unclear definitions or missing stage data.
Trade show follow-up also needs its own scorecard. Compare its accepted leads, opportunities, and pipeline contribution with other event activity rather than forcing it into a paid-media model. The right question isn't which channel has the cheapest lead. It's which channel reliably creates the next stage of revenue.
Account-Level and Speed-to-Lead Metrics for Modern Buying Groups
A form submission rarely represents an industrial buying decision. 72% of B2B purchases involve multiple stakeholders, and 77% of buyers prioritize integration capabilities over standalone features. The same buyer research reports that 68% of buyers start with a preferred vendor and choose that vendor 80% of the time (B2B buyer behavior and account-level engagement data). Measure whether a target account is building buying-group depth, not just whether one person completed a form.
90% of buyers research before first contact, while nearly two-thirds use GenAI tools as much as or more than traditional search (research on the self-educating B2B buyer). Your reporting must account for anonymous research, returning visitors, and the speed of your response after identification.
Four measures for account diagnosis
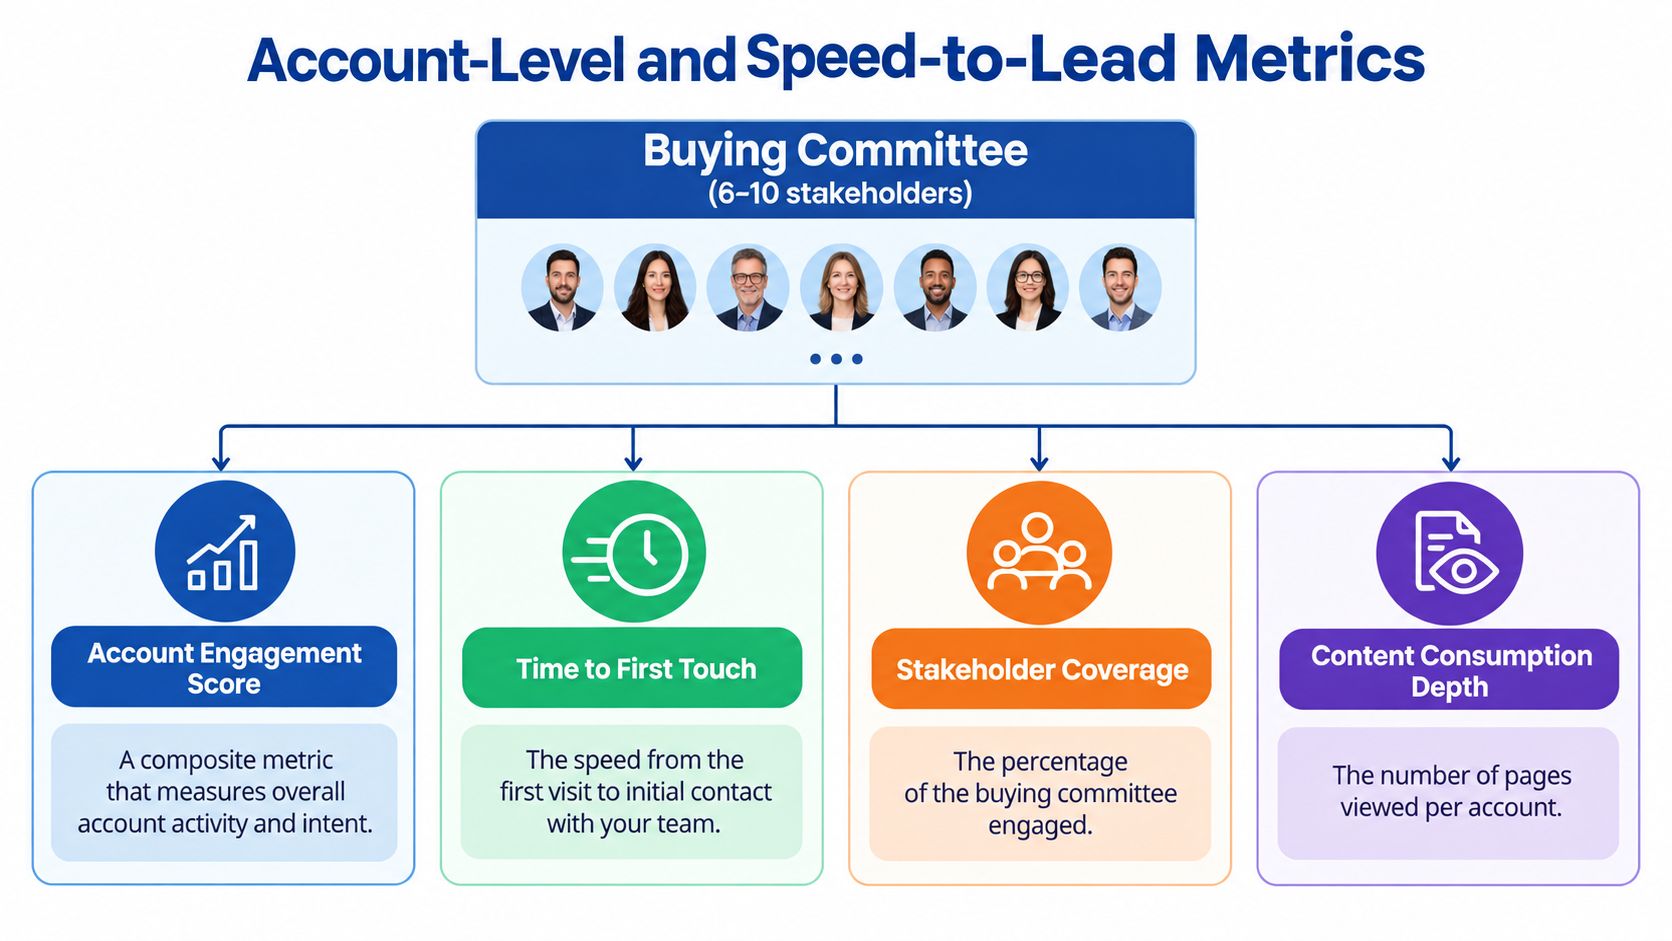
Account engagement score combines meaningful activity from a company, including repeat visits, technical page depth, content consumption, and return visits. Document the weighting system, then test whether high-scoring accounts produce SQLs and opportunities. Exclude low-value activity such as isolated page views.
Target accounts reached counts named companies with identifiable engagement. This shows whether account-based programs reach the industrial market you can serve, rather than producing broad traffic from poorly matched firms.
Buying committee coverage records the distinct roles engaged within an account. Track engineering, operations, procurement, finance, and executive contacts according to the actual buying process. The earlier buyer research makes this a priority: preferred vendors gain an advantage before a single contact requests a quote. Report which roles are engaged and which remain missing.
Speed-to-lead measures the time from the first identifiable session or inquiry to the first human response. Set a service-level rule, assign an owner, and alert the team when a high-fit inquiry has no activity. A useful technical answer keeps evaluation moving. An ignored inquiry loses momentum.
A multi-threaded opportunity requires more than one engaged contact from the same target account within a defined review window. Set the window and required roles from your sales process, then classify each opportunity as single-threaded or multi-threaded.
Measure the account, not just the form. A form identifies the person who raised a hand. Account coverage shows whether a buying process is developing.
Use intent data in your marketing system as a signal layer, not proof of readiness. A high-intent account still requires fit, human verification, and a sales action before it becomes an SQL.
Building the KPI Dashboard in Your CRM
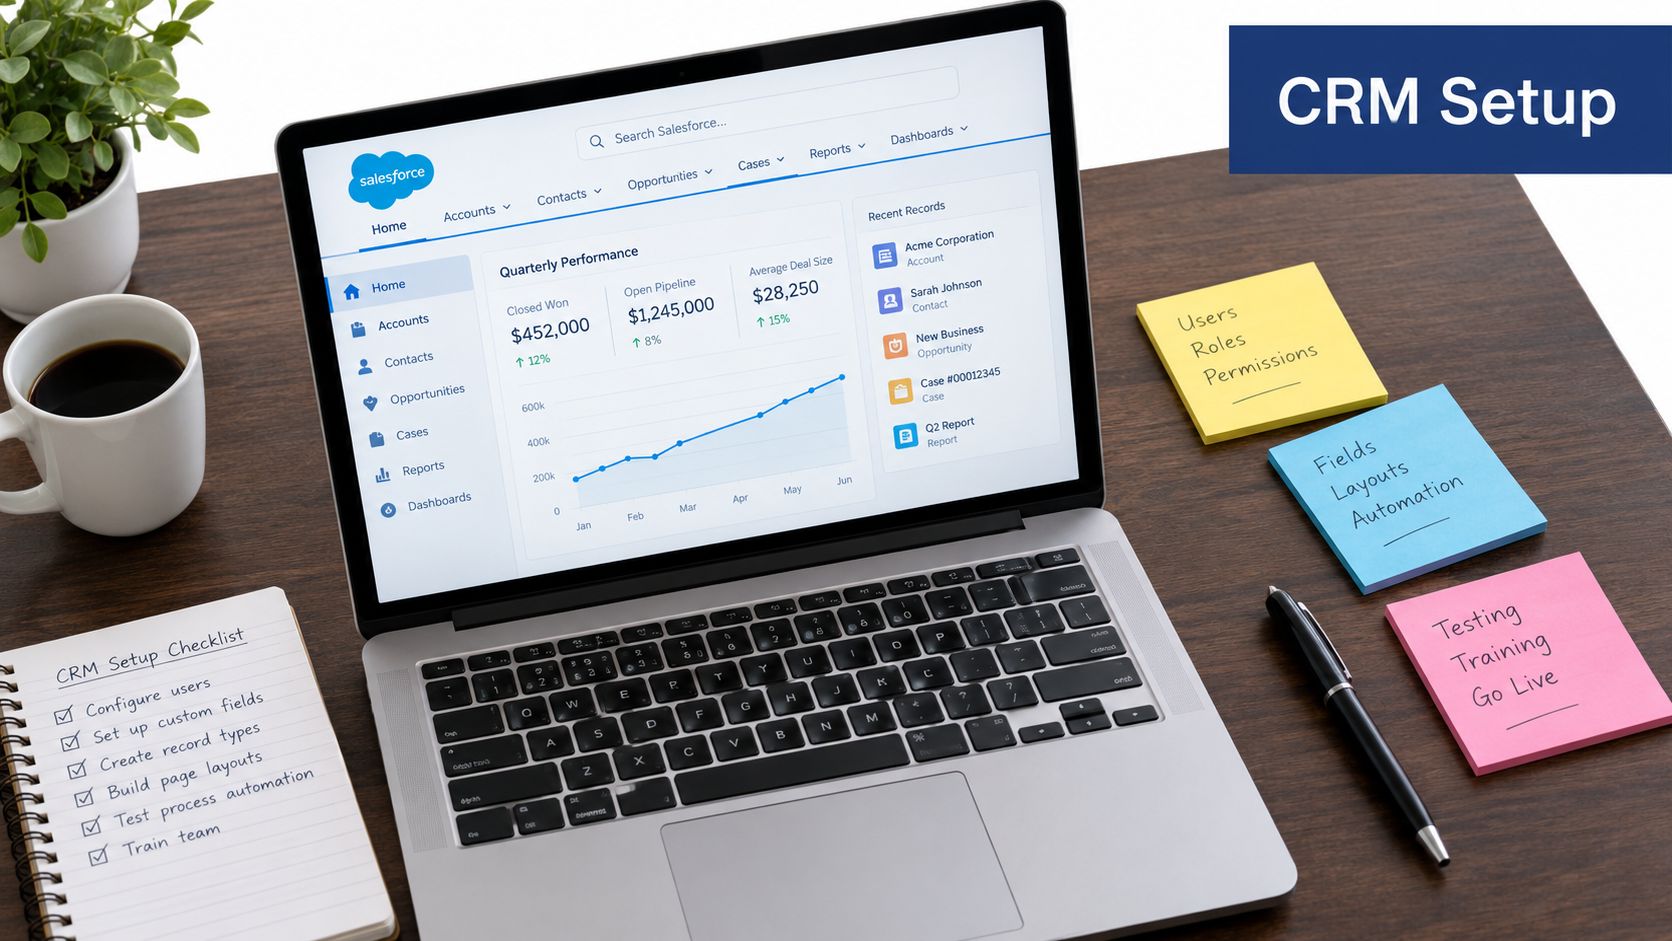
Your CRM must enforce the process behind the numbers. Configure HubSpot or Salesforce to record what changes a stage, assign the next owner, and alert someone when an action is overdue. A dashboard that only stores history will not improve pipeline performance.
Create these contact or lead fields:
- Lead source detail: Original channel, campaign, offer, and referring context
- First touch date: Earliest recorded identifiable engagement
- MQL date: Date the contact met the agreed marketing criteria
- SQL date: Date sales accepted the contact
- Speed-to-lead timestamp: Time of the first human response
- Account engagement score: Current account or contact-level engagement value
Build the deal object around movement
Every deal needs pipeline stage, days in stage, multi-thread count, and last meaningful activity date. Define meaningful activity before reporting begins. An unanswered email may not qualify. A technical meeting, specification exchange, or documented buying-group interaction usually does.
Set up five working views:
- Channel scorecard: Visitor-to-lead, lead-to-MQL, MQL-to-SQL, cost per SQL, opportunities, and pipeline by source
- Funnel-by-stage report: Volume and conversion rates at every handoff
- Account engagement leaderboard: Target accounts ranked by recent meaningful activity and stakeholder coverage
- Speed-to-lead alert queue: New high-fit inquiries without a recorded human response
- Executive pipeline view: New SQLs, pipeline created, and pipeline velocity week over week
Reports should trigger action, not merely display history. Flag an inbound lead that passes the agreed response SLA without human activity. Flag deals that exceed the approved days-in-stage limit, lack meaningful activity by the review date, or remain single-threaded after repeated account engagement.
Set SLA and stage limits from your team's capacity and sales cycle. Do not copy an arbitrary standard into Salesforce or HubSpot. Each threshold needs an owner and a defined next action, such as contacting the account, escalating the deal, or documenting the reason for inactivity.
Use campaign tracking in your CRM to preserve source and campaign detail through the funnel. Reporting breaks when campaign data disappears after a contact converts, changes company, or becomes associated with a deal.
Run the dashboard as a weekly operating rhythm. Marketing reviews source quality and MQL acceptance. Sales reviews response time and stalled SQLs. Leadership reviews opportunity creation, pipeline movement, and the evidence supporting the forecast.
Your 30-60-90 Day KPI Rollout Plan
Don't try to rebuild every report at once. Start by fixing definitions, then make the CRM capture them, then make sales and marketing use the information in routine decisions.
During the first phase, audit the existing fields and reports. Retire raw lead count, MQL volume, CPL, and form-fill rate as executive success measures, while keeping them as diagnostic fields where useful. Lock the formulas from the core KPI table and choose one source of truth for stage definitions.
The second phase is the build. Configure fields, routing rules, attribution conventions, dashboards, and alerts. Run a weekly funnel review that records why contacts were rejected, why SQLs failed to become opportunities, and why opportunities stalled.
The final phase is operational. Hold a Monday metrics meeting with sales, use a 4-to-30 pipeline triage cadence to review the most recent four weeks against the broader thirty-day operating picture, and run a quarterly benchmark review using the industry context already cited. The exact cadence matters less than assigning owners and recording decisions.
| Phase | Days | Action Items | Output |
|---|---|---|---|
| Diagnose | 1 to 30 | Audit CRM fields, define lifecycle stages, retire vanity reporting, confirm formulas, choose the source of truth | Approved KPI dictionary and data-gap list |
| Build | 31 to 60 | Configure fields, routing, campaign tracking, funnel reports, account views, and response alerts | Working CRM dashboard and alert queue |
| Operate | 61 to 90 | Run Monday sales and marketing reviews, apply the 4-to-30 pipeline triage cadence, document dispositions, and review benchmark context | Shared operating rhythm and improvement backlog |
Ship one change this Friday
Create a single report showing every new SQL, its source, assigned owner, date received, date first contacted, current stage, and next action. Send it to both marketing and sales. If the team can't agree on the records in that report, don't buy more traffic until the definitions and handoff are fixed.
The transformation is straightforward: replace activity reporting with stage accountability. You don't need more dashboard tiles. You need fewer definitions, better data capture, faster ownership, and a direct line from source to opportunity.
Machine Marketing helps manufacturers and industrial companies connect lead generation, CRM processes, SEO, content, and sales follow-up around qualified pipeline. Visit Machine Marketing to request a practical diagnosis of your current KPI system and identify the next reporting or routing improvement to implement.