You're probably looking at three dashboards right now, and none of them agree. The ad platform says the campaign is working, the CRM says the leads are thin, and sales says the names aren't worth chasing. That gap is exactly where ad effectiveness measurement breaks in industrial B2B, and it's why we need to treat measurement like a system, not a screenshot.
The good news is that the fix isn't mystical. You don't need a fancier report, you need a defensible way to connect exposure to revenue, separate what the platform reports from what changed in the pipeline, and build a measurement stack your team can trust week after week. The rest of this article gives you that system in practical terms, with the trade-offs laid out plainly.
Table of Contents
- Why Industrial Ad Measurement Keeps Breaking
- Set Business Goals Before You Pick a Metric
- Choose KPIs That Match Your Funnel Stage
- Build the Tracking Stack That Actually Holds
- Attribution Models, MMM, and Lift Tests Compared
- Designing a Lift Test You Can Trust
- Dashboards, Reports, and a 30-60-90 Day Build Plan
Why Industrial Ad Measurement Keeps Breaking
A familiar scene plays out in manufacturing marketing teams. One dashboard shows traffic, another shows conversions, and a third shows something the agency calls “quality” while the sales team calls it noise. Leadership asks what the ads produced, and nobody can answer without hedging.
That's not a reporting problem. It's a measurement design problem.
The real failure is treating one platform's version of reality as the truth
Industrial buying cycles are long, the decision group is messy, and one click rarely tells the full story. A plant manager might see the ad, a production engineer might research later, and procurement might enter the process weeks after that. If you only count the final click, you miss the chain of influence that moved the deal forward.
The measurement framework matters because digital performance metrics now make it possible to track campaigns from exposure to revenue using a standard funnel of impressions, reach, frequency, CTR, CPC, CVR, CPA, ROAS, and ROI (Ficilcom ad measurement guide). But the platform report is still only one lens. It tells you what happened in that system, not whether the campaign caused the outcome.
Practical rule: if sales and marketing can't trace a lead from source to revenue, the dashboard is describing activity, not effectiveness.
Measurement has to account for more than clicks and conversions
The stronger model looks at awareness, ad recall, consideration, purchase intent, and conversion together, not just the bottom of the funnel (Dynata on measuring advertising effectiveness). That matters in industrial B2B because a campaign can look efficient in platform reporting and still fail to change how a buyer thinks about the vendor.
The hidden risk is frequency. Too few exposures don't build memory, and too many can waste spend on the same audience. If you're only looking at last-click or platform-attributed conversions, you won't see that pattern until the pipeline has already drifted.
Your first job is simple. Audit every number you currently trust, then write down where it came from, who owns it, and what business question it answers. If you can't trace the source of a metric, you can't defend it in a budget meeting.
Set Business Goals Before You Pick a Metric
Many teams start with a dashboard. Better teams start with revenue math.
If you're selling machines, tooling, components, or fabrication services, the key question isn't “What was the CTR?” It's “How much pipeline do we need, how many qualified opportunities does that require, and what can we afford to pay to create them?” Once you answer that, the metric choice becomes obvious.
Start with the revenue target, then work backward
A clean goal sheet should begin with the business outcome, not the ad tactic. Define the target revenue, the margin you need to protect, the average deal size, and the close rate your sales team can sustain. From there, work backward to the pipeline value and lead volume required to support that target.
That gives you a practical budget boundary. It also stops the common habit of judging campaigns against vanity numbers that never tied to the actual sales model.
The funnel metrics then become a translation layer, not the goal itself. CTR = clicks ÷ impressions, CVR = conversions ÷ clicks, and CPA = ad spend ÷ conversions. Those formulas are core to modern measurement because they connect media delivery to business outcomes, and the same framework stretches across search, display, social, and other paid channels (Ficilcom ad measurement guide).
| KPI | Formula | Best for |
|---|---|---|
| CTR | Clicks ÷ impressions | Testing message pull and ad engagement |
| CVR | Conversions ÷ clicks | Gauging landing page and offer fit |
| CPA | Ad spend ÷ conversions | Managing lead cost in B2B campaigns |
| ROAS | Revenue ÷ ad spend | Revenue-tracked campaigns |
| ROI | Net return ÷ investment | Executive-level budget decisions |
Use ROAS and CPA for different jobs
ROAS matters most when revenue can be measured directly. CPA matters most in B2B lead generation, where the conversion is often a lead, not an immediate sale (Ficilcom ad measurement guide). That distinction is important because a sales-qualified lead and a closed deal are not the same thing, and your measurement should reflect that.
A practical goal sheet should include one business target, one primary ad objective, and one metric that tells you whether the campaign is pulling in the right direction. If your team can't explain how a media goal turns into a revenue target, the KPI is probably backwards.
For a deeper planning framework, the marketing ROI guide is worth keeping handy as a reference point for your internal model.
What to ask yourself: if we doubled spend tomorrow, would this metric still tell us whether the business got healthier, or just busier?
Choose KPIs That Match Your Funnel Stage
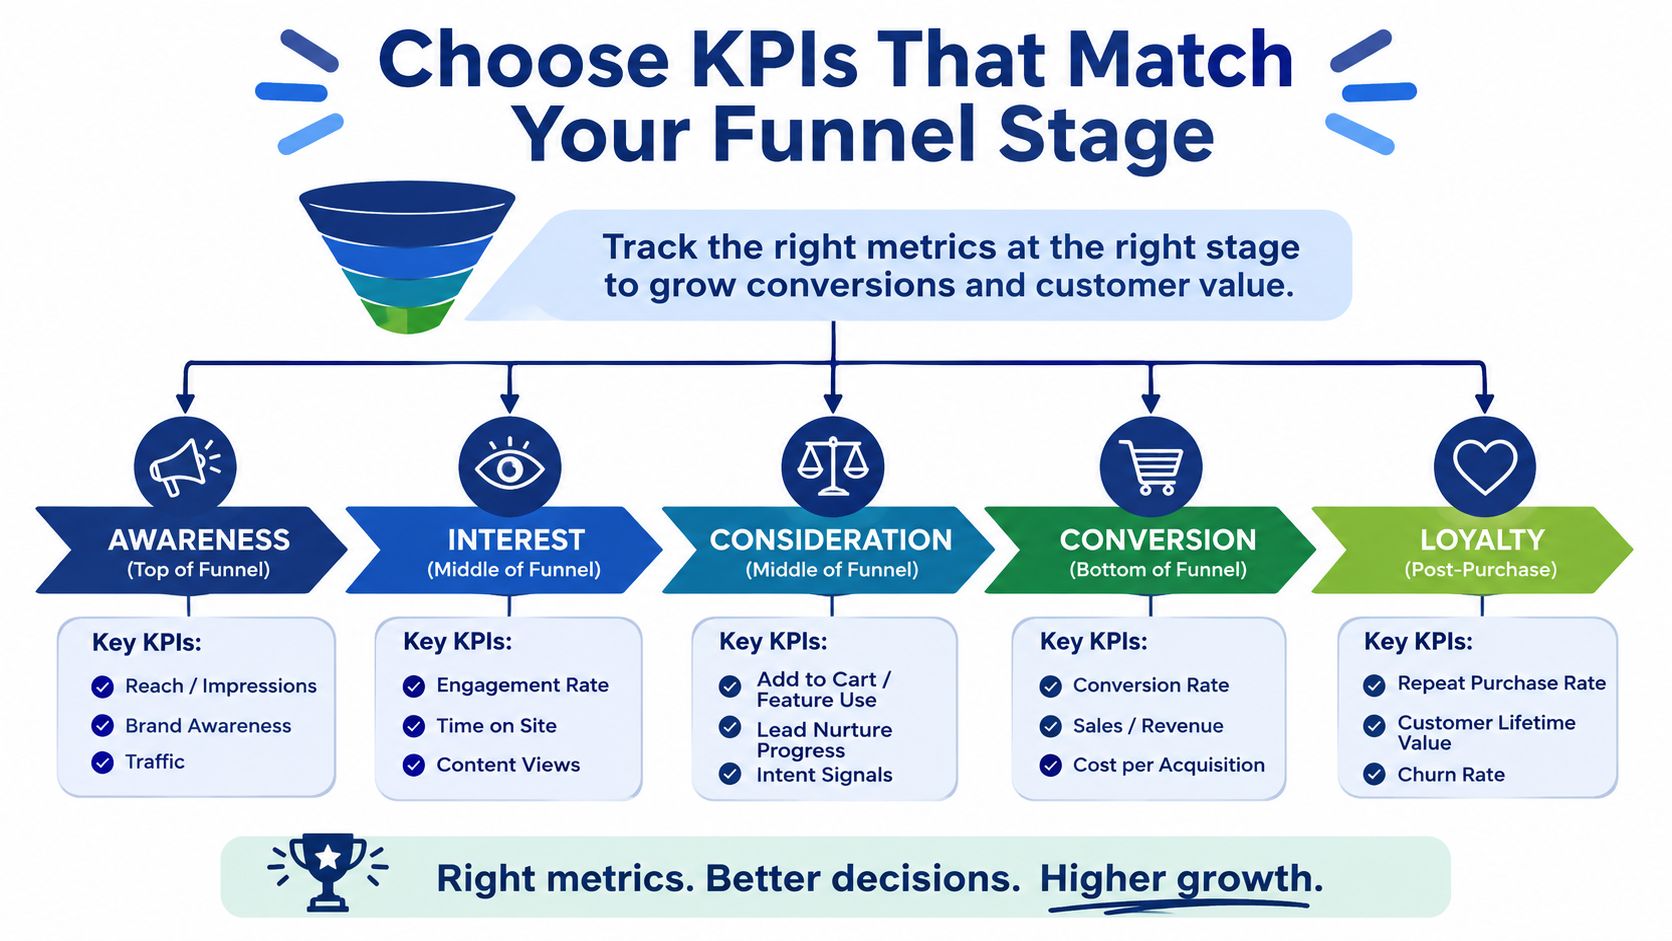
The fastest way to wreck ad reporting is to use the same KPI for every campaign. A new product launch, a remarketing campaign, and an existing demand-capture campaign all need different signals, because they're solving different problems.
The clean way to think about it is by funnel stage. Awareness needs one kind of proof, consideration another, and conversion another. If you force every campaign into the same metric, you'll either over-credit weak activity or under-credit the parts of the funnel that do the heavy lifting.
Align the KPI to the job the campaign is supposed to do
At the awareness stage, reach, frequency, and ad recall lift matter more than last-click behavior. The question is whether the right people saw the ad and remembered it. In industrial markets, that's often the first sign that a campaign is doing useful work, especially when the buying group is small and the sales cycle is slow.
At the consideration stage, CTR, video completion, and branded search lift are more telling. These signals don't close the deal, but they show whether the message is pulling the audience closer to action. If CTR is weak, don't immediately blame the channel. Sometimes the creative is the problem, not the audience.
At conversion, the focus shifts to CVR, CPA, pipeline value, and closed revenue. That's where lead quality, sales follow-up, and CRM hygiene matter as much as media. Platform-attributed conversions often overstate performance here because they credit the last interaction, even when earlier touchpoints did most of the work.
Build one KPI map per campaign, not one KPI for the whole account
A product-launch campaign might use reach as the primary metric and ad recall as the guardrail. A remarketing campaign might use CPA as the primary metric and frequency as the guardrail. The anti-metric is the number that keeps you honest, such as raw clicks when you care about lead quality.
That one-page map is what keeps reporting sane. It tells everyone on the team what success looks like before the ads run, and it gives sales a clearer explanation for why some campaigns are supposed to create demand instead of harvest it.
If you need a deeper model for comparing channel influence, the cross-channel attribution guide can support the internal conversation without turning the whole thing into theory.
Build the Tracking Stack That Actually Holds
Most measurement failures start long before the report. They start with messy source data, inconsistent naming, broken form tracking, and sales reps entering leads as “web” because nobody gave them a better field structure.
If you want trustworthy ad effectiveness measurement, you need a tracking stack that survives normal human behavior. That means fewer assumptions, more required fields, and a clean handoff between marketing and sales.
Put the identifiers in place first
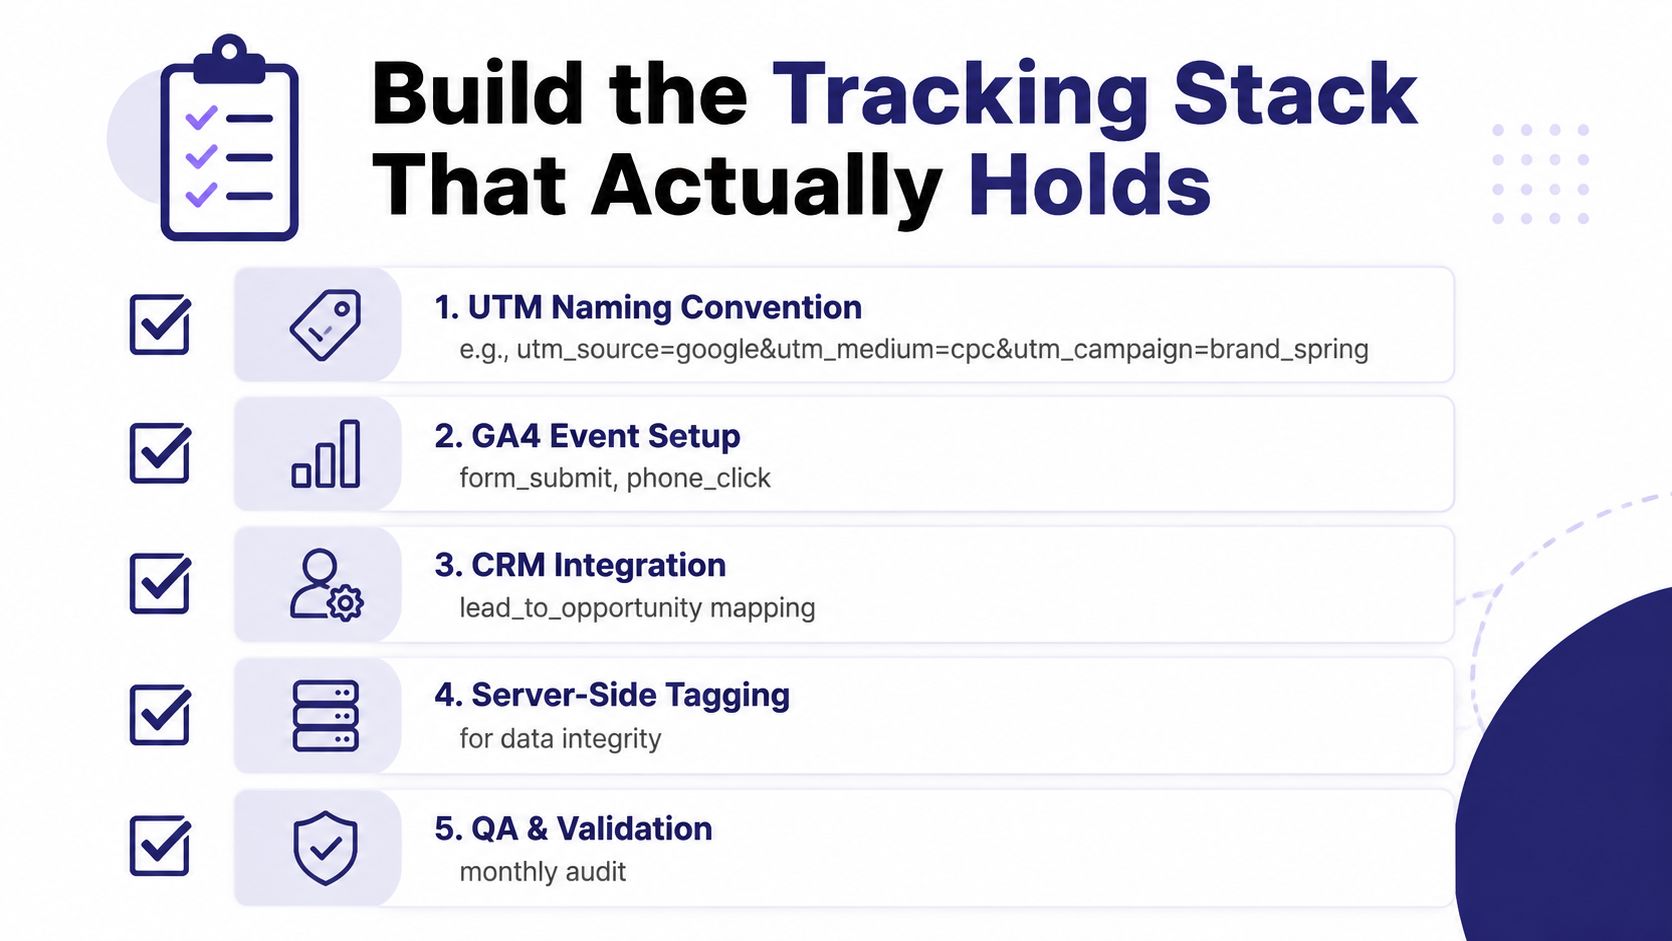
Start with a strict UTM naming convention. If a campaign can be tagged three different ways, it will be tagged three different ways, and every report downstream will fracture. A simple convention should define source, medium, campaign, and content fields before anything goes live.
Next, tie GA4 events to the actions that matter. Form submissions, phone clicks, and key quote requests should each fire clean events so you can see whether traffic became intent. That's the difference between “people visited” and “people raised their hand.”
Then lock in the CRM fields that keep attribution from collapsing. Source, medium, campaign, lead owner, and lead status should be required where possible. If a rep can save a lead without origin data, you'll lose the chain between spend and opportunity.
Practical rule: if the CRM can't tell marketing which lead came from which campaign, the team is flying blind even if the ad platform looks clean.
Close the loop between marketing and sales
Offline conversion imports matter because not every meaningful action happens on the website. A lot of industrial buying happens in calls, quote requests, and follow-up emails, so the ad system has to learn from sales outcomes too. That's where server-side tagging and clean CRM integration protect data integrity and keep the platform from making decisions on partial information.
A good setup guide can save time here. The campaign attribution setup guide is useful because it keeps the focus on structure, not just tags.
For a broader architecture view, the marketing technology stack resource is helpful when you're mapping tools to responsibilities.
Use this sprint checklist this week:
- Standardize UTMs: lock source, medium, campaign, and content naming before the next launch.
- Confirm GA4 events: verify that form_submit and phone_click are firing properly.
- Require CRM fields: make source, medium, and campaign mandatory on new leads.
- Validate offline imports: make sure opportunity and closed-won data can flow back.
- Audit for duplicates: look for multiple tags on one visit, missing source data, and leads logged as generic web.
Attribution Models, MMM, and Lift Tests Compared
There are three measurement families that matter in industrial B2B. They answer different questions, and none of them should be treated as a religion.
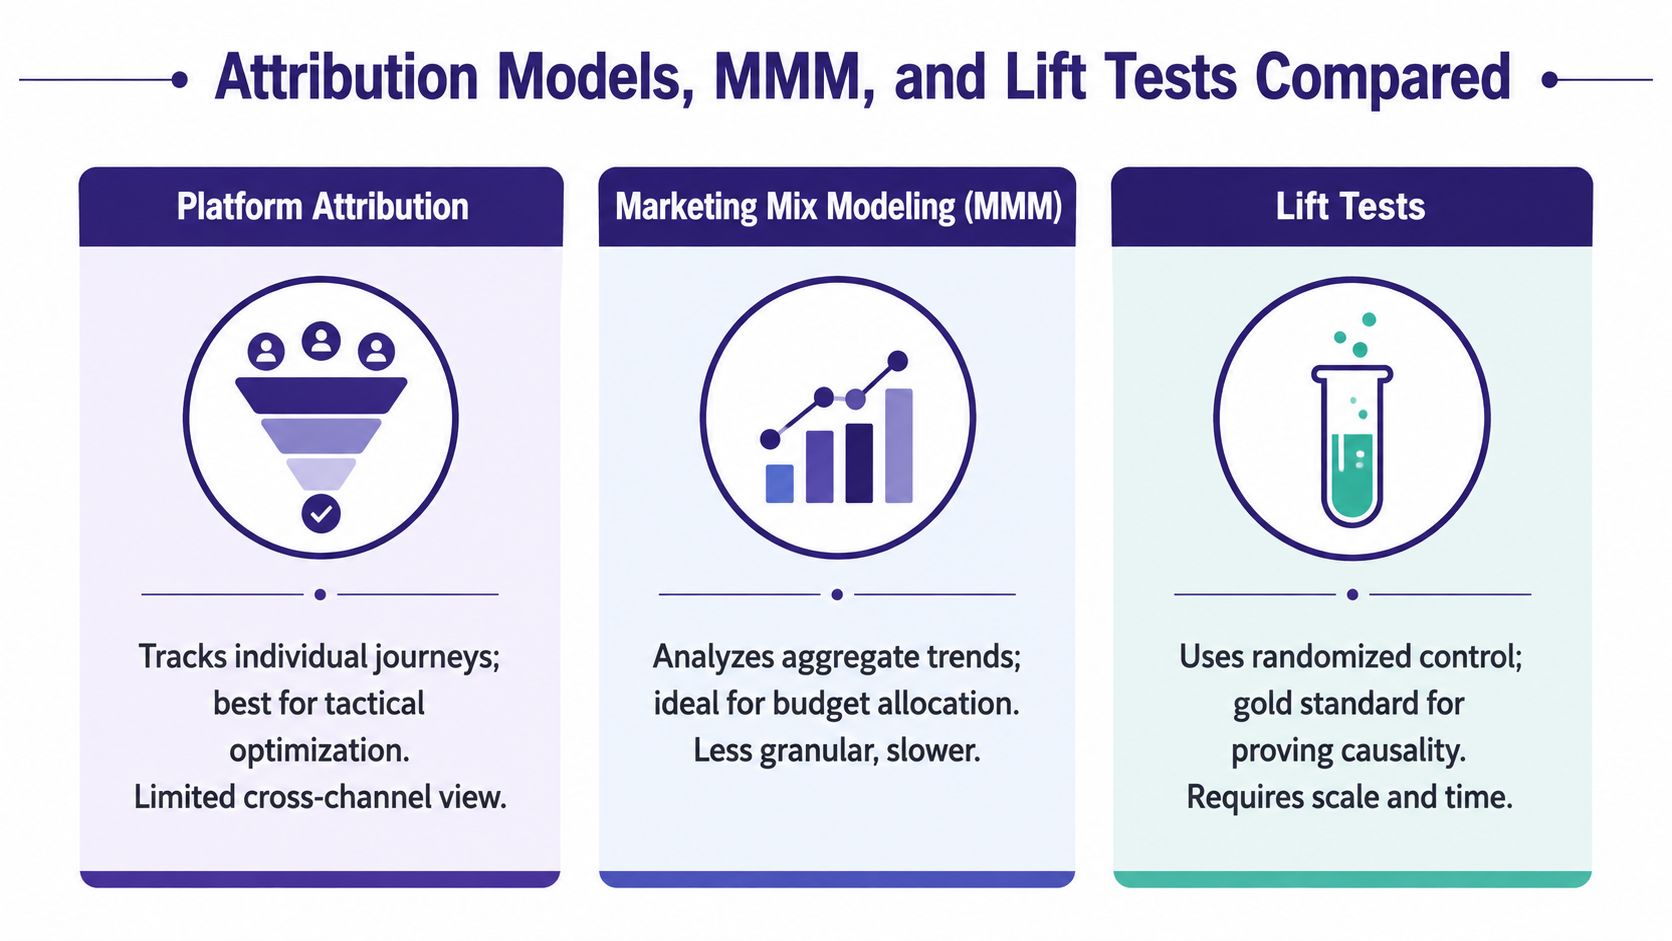
Platform attribution is fast and useful for tactical optimization. MMM looks at the bigger business pattern. Lift tests tell you whether the ad caused change. If you try to use one of them for every decision, you'll end up overconfident in the wrong places.
Each model answers a different question
Platform attribution, including last-click and data-driven models, is good for seeing which touchpoints are associated with conversion inside the ad platform or analytics stack. It's fast, which is why teams reach for it first. The problem is that it can over-credit campaigns that were nearby when the conversion happened, not necessarily responsible for it.
MMM looks at aggregate trends across channels, sales, and external factors. It's useful for budget allocation and medium-term planning because it sees the mix as a whole. The trade-off is that it needs more data, more modeling discipline, and more time.
Lift tests are the cleanest way to measure incremental impact because they use exposed and holdout groups. They isolate causality better than platform reporting can. The limitation is practical, not theoretical, since they need enough audience volume and enough discipline to run without peeking too early.
The strongest source-based framing here is simple. The most defensible way to measure effectiveness is to combine a randomized holdout test with attribution and MMM, then calculate true ROAS as (revenue from exposed group minus revenue from holdout group) ÷ ad spend (AdLibrary on measuring advertising effectiveness).
Use the right tool at the right cadence
A mid-market manufacturer usually doesn't need to choose one model forever. A layered approach works better. Use platform attribution for week-to-week optimization, use MMM when budget and data volume justify it, and run holdout tests often enough to keep the rest honest.
For a deeper product-leadership perspective on multi-touch logic, the attribution modeling guide for product leaders is a solid reference point. It helps frame attribution as a decision tool rather than a scoreboard.
A useful comparison is also available in the cross-channel attribution guide, especially if your team needs to compare channels without mixing business questions.
Bottom line: if a model can't answer the exact question you're asking, it's not the wrong model, it's the wrong job.
Designing a Lift Test You Can Trust
The most useful test in industrial B2B is usually the simplest one you can execute without breaking operations. Pick one campaign, one channel, and one outcome that matters to the business, then design the test so it can answer a causal question instead of a vague reporting question.
The point isn't to prove that advertising works in the abstract. The point is to prove whether this campaign changed behavior enough to justify the spend.
Build the test around incrementality, not exposure
Start by splitting the target audience into exposed and holdout groups. The holdout group is your control, the part of the audience that doesn't receive the campaign. Compare post-test conversion rates between the two groups to estimate incremental lift.
Use a primary KPI that reflects business value. For most manufacturers, that means a qualified lead or pipeline value, not CTR. CTR can be useful, but it won't tell you whether the campaign changed buying behavior.
Then set a fixed time window tied to your sales cycle. The test has to run long enough for the response to show up in the CRM and long enough for the holdout to mean something. If you end it too early, you'll only measure noise.
Read the result the right way
The formula for incremental lift is straightforward. It's the conversion rate of the exposed group minus the conversion rate of the holdout group. That tells you what changed because the ad was there, not just what happened around the same time.
Use the same discipline for revenue. True ROAS is (revenue from exposed group minus revenue from holdout group) ÷ ad spend (AdLibrary on measuring advertising effectiveness). That's a much better number to bring into leadership discussions than a platform ROAS that may be counting conversions that would've happened anyway.
Practical rule: don't test on CTR unless your real business question is creative engagement. For most industrial campaigns, it isn't.
The trade-offs are real. You give up some reach during the test window, and you have to resist the urge to peek at the numbers before the audience has had time to respond. Small audiences can make this approach hard to run cleanly, and in that case the honest answer is to keep building volume before claiming certainty.
For teams who want to see the structure in motion, the video below is a useful companion.
Dashboards, Reports, and a 30-60-90 Day Build Plan
A good dashboard should make decisions easier, not create another committee meeting. The best version has four layers, business outcomes, funnel KPIs, channel efficiency, and experiment results, all on one page or one screen.
If you want a model for how monitoring turns into action, the business monitoring for data-driven decisions resource is a useful comparison point. It reinforces the same principle you need here, namely that monitoring should support decisions, not bury them.
Keep the weekly review short and strict
Your weekly meeting should take 30 minutes, not three hours. Ask three questions per channel. Did the numbers move, did the audience quality hold, and did the experiment teach us anything? If a report can't answer those questions, it's too busy.
Use a 30-60-90 plan so the work doesn't sprawl:
- Days 1 to 30: fix tracking, naming conventions, CRM fields, and KPI definitions.
- Days 31 to 60: run the first lift test and stand up attribution reporting.
- Days 61 to 90: produce the first defensible true-ROAS number and make a reallocation decision.
That sequence keeps the team from debating models before the inputs are clean. It also creates a measurement system that compounds instead of a one-time report that gets ignored after the meeting.
If you want a partner to pressure-test the system, book a measurement diagnostic with Machine Marketing. We'll look at the tracking chain, the KPI logic, and the reporting structure so you can see where the numbers are trustworthy and where they're not.
If you're ready to stop guessing which ads changed your pipeline, Machine Marketing can help you rebuild the measurement system from goal setting to true ROAS. Visit Machine Marketing to book a measurement diagnostic and pressure-test your current reporting before the next budget review.