Most industrial buying decisions are made before a manufacturer knows a prospect exists. Gartner's 2024 B2B Buying Survey found that buyers spend only 17% of the total purchase journey meeting potential suppliers, while 77% describe their last purchase as very complex or difficult and buying committees typically include 6 to 10 decision-makers. The benchmark summary points to the uncomfortable reality: your CRM often records the visible tip of a much longer, committee-driven process.
That's why B2B customer journey mapping shouldn't be a marketing poster. It should operate like an engineering system, tracing how buyers research, compare, validate, approve, implement, and adopt your solution. We'll show you how to build that system for manufacturers, machine shops, and industrial companies, including what the map can diagnose, what it can't repair, and how to make it useful within 30 days.
Table of Contents
- What B2B Customer Journey Mapping Actually Solves
- Why the Industrial Buying Journey Is Not a Funnel
- Mapping the Buying Committee Instead of the Buyer
- A Practical Framework to Build Your First Map
- Machine Shop and OEM Journey Map Examples
- Tools and Templates Worth Using
- KPIs and Instrumentation That Make the Map Useful
- Your 30-Day Starting Plan and What to Do Next
What B2B Customer Journey Mapping Actually Solves
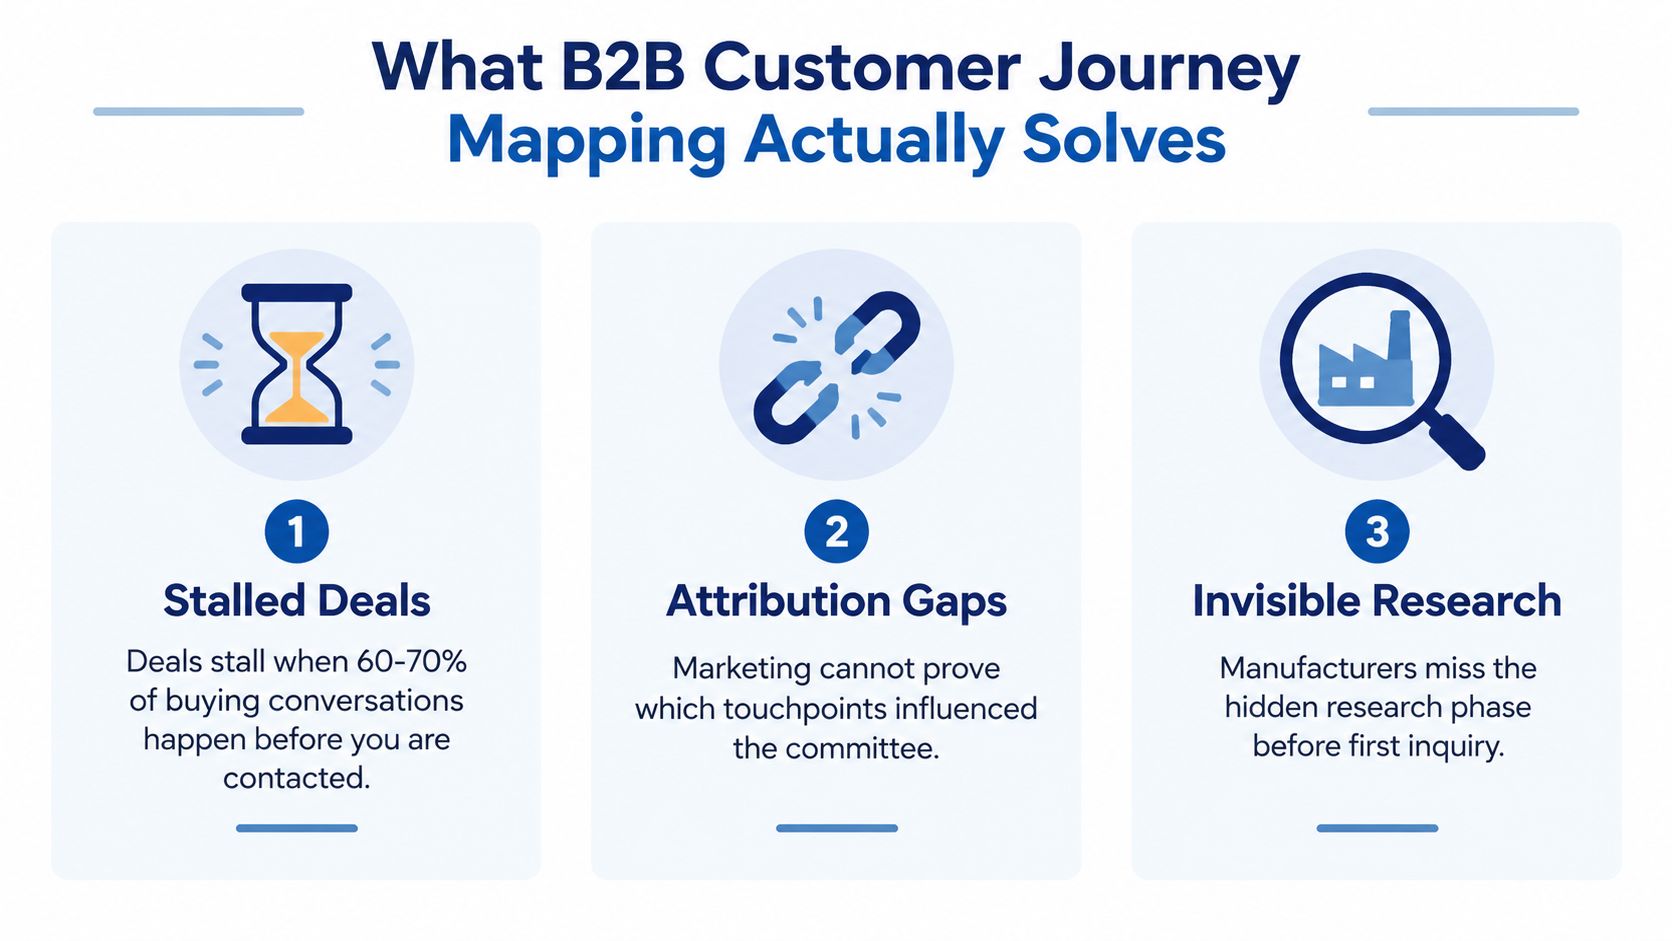
Poor visibility creates familiar symptoms. Deals stall after a strong technical call. Marketing can't explain which content influenced an opportunity. Sales believes the buyer is ready, while engineering or procurement hasn't even entered the process. The largest blind spot sits before the first inquiry, when buyers research independently, compare suppliers, and build internal opinions without appearing in your pipeline.
This article treats the map as a working operating model, not theory. B2B customer journey mapping documents how a buying committee discovers, evaluates, approves, implements, and adopts an industrial solution across digital, human, and operational touchpoints. It connects evidence from your website, CRM, quoting system, sales conversations, engineering activity, service records, and customer interviews.
The three problems worth solving
Invisible decision criteria. Your technical evaluator may be comparing tolerances, cycle time, integration requirements, documentation, or validation procedures that your website never addresses. The map exposes those criteria before they become late-stage objections.
Broken internal handoffs. Marketing may generate interest, sales may qualify the account, and sales engineering may answer technical questions, but nobody owns the transition into operations, procurement, or implementation. A shared map gives each team a view of what the next stakeholder needs.
Unmeasured adoption. A signed order doesn't prove that the customer is realizing value. Implementation friction, weak training, unclear ownership, or poor usage can undermine retention long after the opportunity leaves the CRM. Recent journey research argues for mapping implementation and usage as part of the lifecycle, not stopping at purchase. The academic framework supports treating post-sale experience as a core phase.
Journey mapping has limits. It won't fix poor product-market fit, uncompetitive pricing, or a sales team that lacks technical credibility with plant managers. It also won't create demand where your offer is irrelevant. It will show you where those problems appear, who experiences them, and which evidence your team is missing.
For a broader foundation, compare this approach with guidance on how to map B2B SaaS buyer journeys, then adapt the method to your industrial buying committee and longer implementation cycle.
Why the Industrial Buying Journey Is Not a Funnel
A funnel assumes one buyer moves forward through predictable stages. Industrial purchasing rarely works that way. Gartner describes B2B buying as a loop across problem identification, solution exploration, requirements building, and supplier selection, with buyers moving between digital and human interactions. Gartner's buying journey model is a better foundation for manufacturers than a neat awareness-to-close diagram.
The difference matters because an industrial purchase can remain active for 272 days on average across a large-scale benchmark covering 3.5 million journeys and 66 million sessions. The same synthesis reports 88 touchpoints, four channels, and 10 stakeholders on a typical journey, with first impression to closed revenue taking 320 days. The underlying buyer-journey synthesis makes the operational implication clear. Your team needs to track recurring activity, not just stage progression.
Three reasons the funnel breaks
First, committee members consume information in different orders. An engineer may begin with a specification sheet. An operations leader may start with uptime concerns. Finance may enter only after the business case is written. Procurement may reopen supplier comparisons after technical approval. A single account stage hides these parallel investigations.
Second, objections send buyers backward. A pricing review can trigger renewed technical research. A new stakeholder can force the champion to rebuild the internal case. A failed proof point can return the committee to requirements building, even if your CRM still shows “proposal.”
Third, post-purchase evidence feeds the next purchase. A customer's implementation experience, service interaction, and operational results shape future expansion and referrals. Mapping ends at signature, and you lose the feedback loop that tells marketing which promises hold up in the plant.
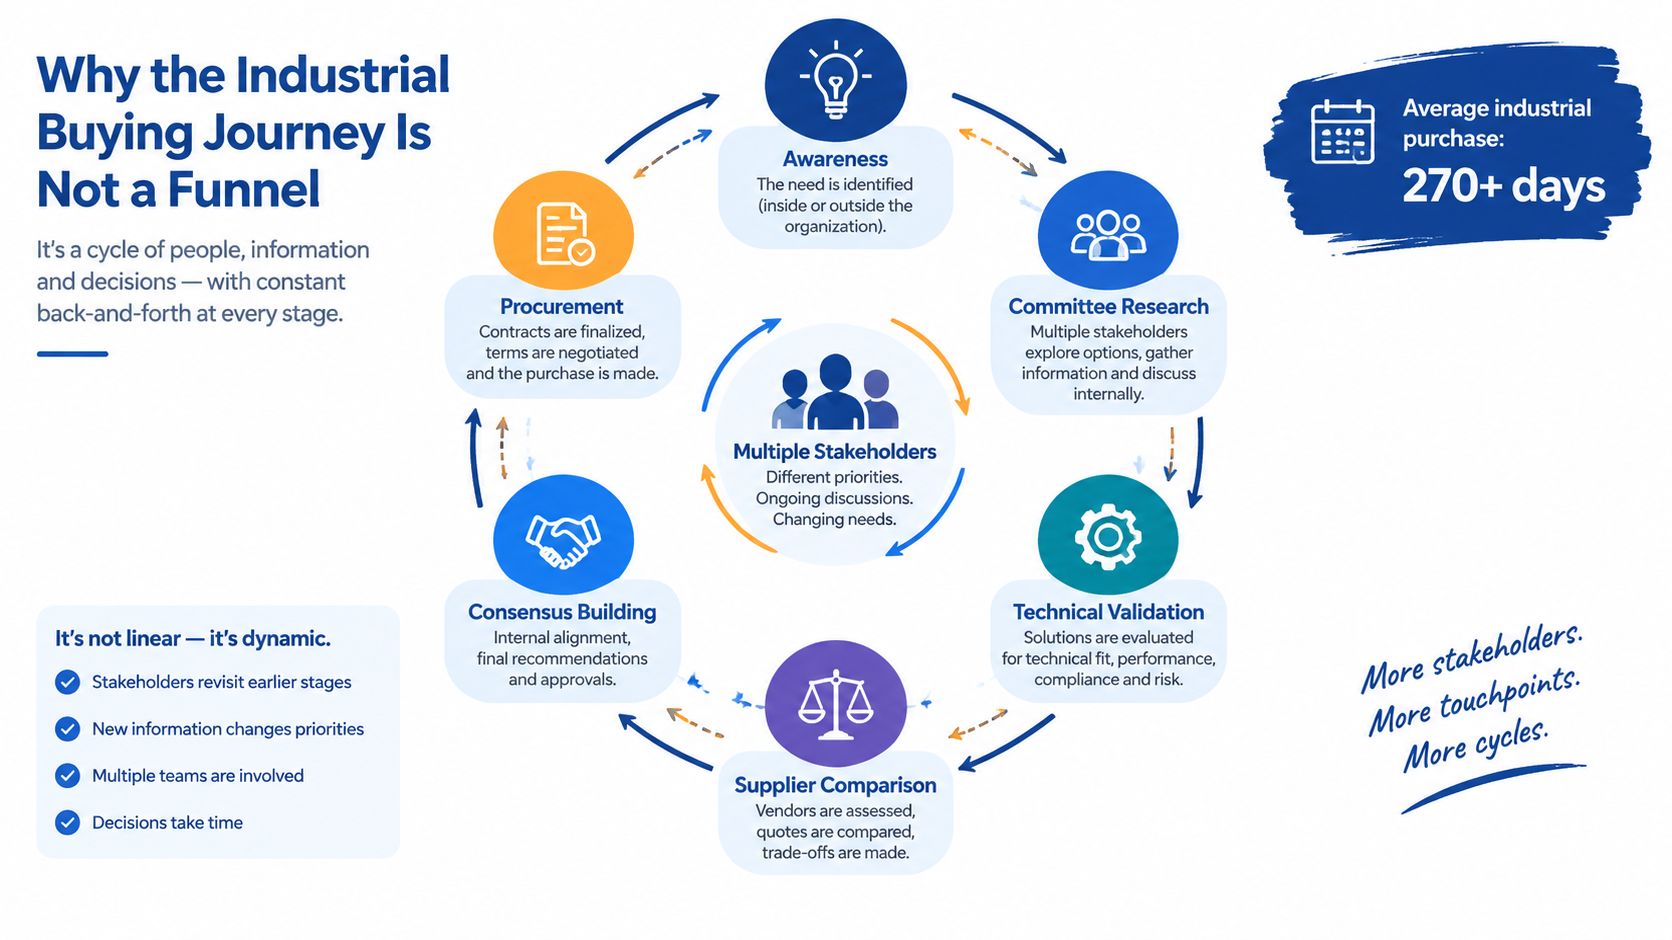
Practical rule: Map the buyer's movement between questions, stakeholders, and validation points. Don't force every interaction into a forward-moving funnel stage.
A useful map shows dormant stages that can reactivate, parallel role-based paths, and the evidence required to create consensus. It should also distinguish anonymous research from known engagement. Buyers may complete about 67% of their journey digitally or independently before speaking with sales, and another benchmark places pre-contact research at 57% to 70% of the journey. The benchmark summary explains why your map must include search behavior, technical content, peer validation, and follow-up timing before a form fill.
Mapping the Buying Committee Instead of the Buyer
The individual who submits an RFQ isn't necessarily the person who decides whether your quote survives. In an industrial purchase, the decision structure often includes a champion, technical evaluator, operations leader, finance or procurement officer, and executive approver. Each role has a different definition of risk, value, proof, and readiness.
Forrester's 2026 business buying outlook describes a typical decision as involving 13 internal stakeholders and nine external influencers, with complexity increasing for strategic purchases. Forrester's newsroom summary supports a role-based model rather than a channel-only map.
The role-based view
A champion identifies the need and sells the project internally. A technical evaluator tests specifications and implementation requirements. Operations assesses integration, uptime, safety, and disruption risk. Procurement controls commercial terms and supplier process. An executive approver decides whether the investment belongs in the budget.
If you map only channels, you'll see website visit, trade show, email, phone call, and quote. That sequence tells you almost nothing about why the opportunity moved or stopped. Mapping by role reveals that engineering was comparing cycle-time data you never published, procurement was benchmarking payment terms, and the champion lacked a presentation to use internally.
| Role | Primary Evaluation Focus | Content They Consume | Engagement Signal |
|---|---|---|---|
| Champion | Business problem and internal momentum | Problem guides, business cases, implementation summaries | Shares material with colleagues |
| Technical evaluator | Specifications, integration, validation | CAD files, technical sheets, testing documentation | Repeated technical-content visits |
| Operations leader | Uptime, workflow fit, operational risk | Deployment plans, service details, process examples | Requests operational review |
| Finance or procurement | Commercial terms, total cost, supplier risk | Pricing structure, terms, compliance documents | Enters quote or vendor review |
| Executive approver | Strategic fit, financial justification, confidence | Executive summary, risk plan, investment case | Joins approval conversation |
Use separate role records or fields in the CRM so one account can show multiple participants without treating them as duplicate leads. A practical buyer persona creation framework can help you document each role's responsibilities, questions, information sources, and decision authority.
The unit of analysis should be role plus stage, not person plus channel. For each cell, record what the role needs to know, what proof exists, what interaction occurred, and what signal would justify the next action. That structure turns a crowded touchpoint list into a diagnosis of consensus formation.
A Practical Framework to Build Your First Map
Don't begin by buying software. Begin with evidence. A useful first map can come from customer interviews, CRM history, quote records, sales notes, engineering feedback, and service data if someone organizes those inputs around the same committee and stage model.
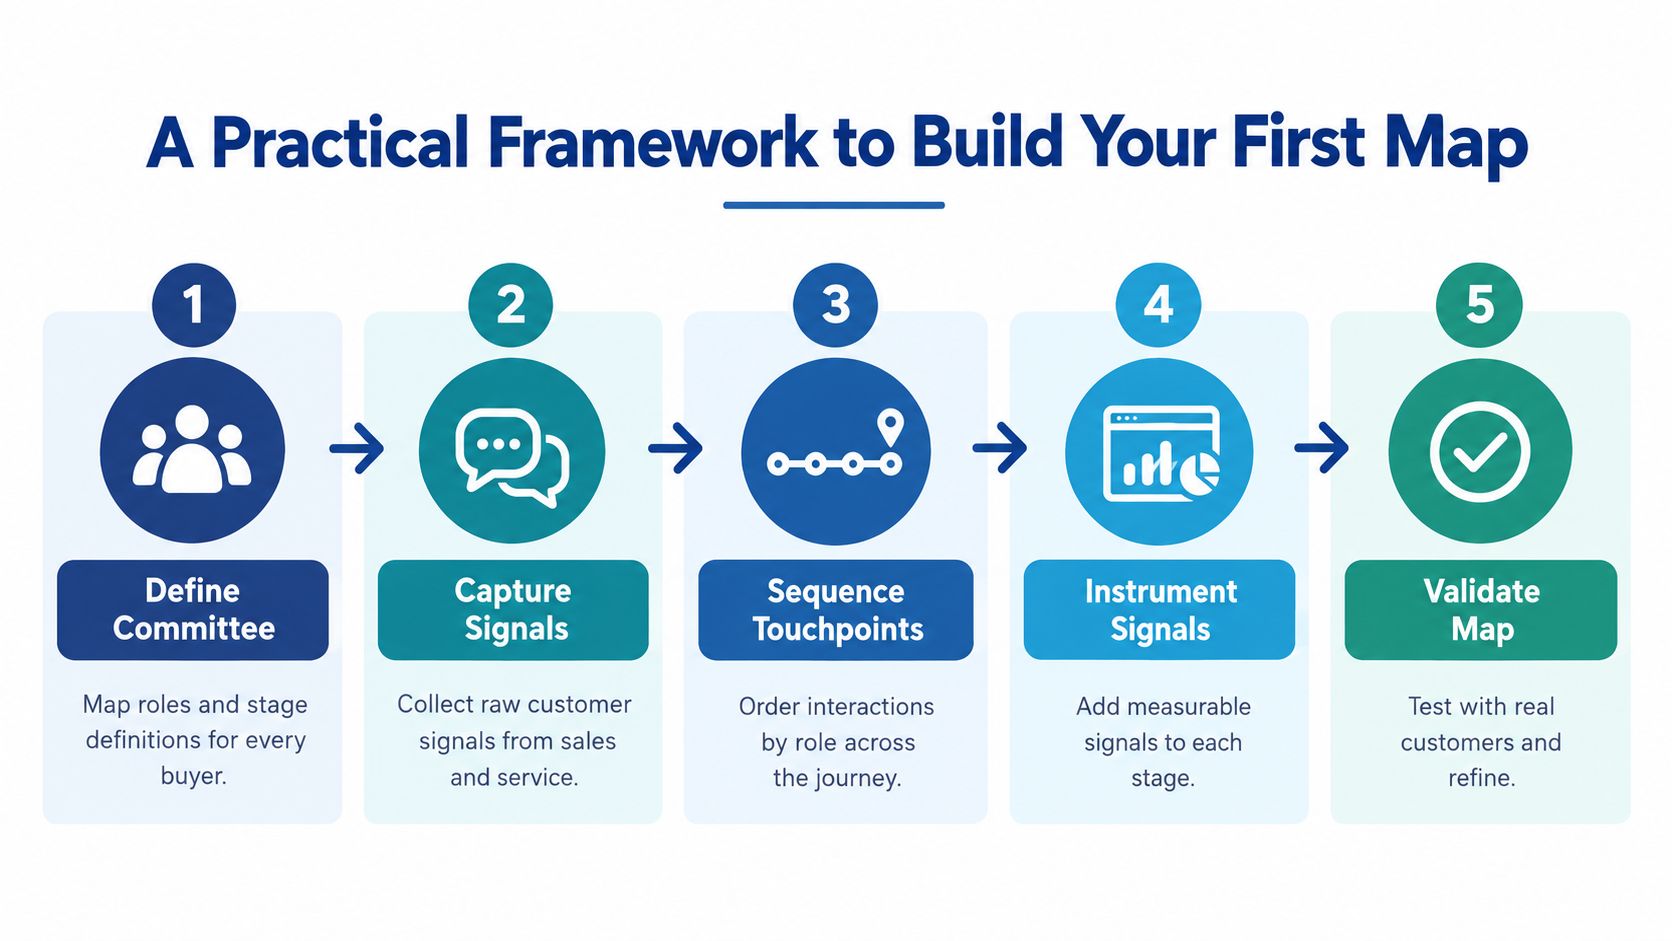
Step one, define the committee and stages
Name the roles involved in a real purchase, then define the stages in observable terms. A practical sequence is:
- Problem recognition
- Independent research
- Requirements and technical validation
- Supplier comparison and consensus
- Purchase, implementation, adoption, and expansion
Don't define a stage as “consideration” unless you can identify the behavior that proves it. “Technical evaluator reviewed the specification package” is useful. “Prospect is interested” isn't.
Step two, capture raw customer signals
Run two parallel exercises.
For a 40-person machine shop mapping a $50K multi-axis machining contract, conduct two customer interviews and pull the last 20 RFQs from the CRM. Look for recurring questions, quote revisions, silent losses, and the people who appeared after the initial inquiry.
For an industrial OEM mapping a $1.2M capital equipment sale, use five plant visits and three lost-deal autopsies. The longer discovery cycle requires more direct observation because procurement, engineering, operations, and leadership may enter at different points.
Step three, sequence touchpoints by role
Put interactions in time order, but keep separate lanes for each role. Record the source, the question being answered, the person responsible, and the next dependency. This will expose gaps that a single account timeline hides.
Step four, instrument each stage
Assign an observable signal to each stage. Examples include repeated visits to specification content, a technical meeting with a second stakeholder, an RFQ revision, a procurement document request, or an implementation kickoff. Pair each signal with an owner in marketing, sales, engineering, or service.
Step five, validate against a closed-won deal
Test the model against one completed purchase. If the map can't explain who created urgency, who challenged the decision, what proof resolved the concern, and how adoption began, it isn't ready.
Your one-page template should use stages as rows and committee roles as columns. Each cell should contain three items:
- Evidence: What the buyer did, asked, reviewed, or rejected
- Content or enablement: What helped the role make progress
- KPI: What your team can measure and who owns it
The map becomes valuable when sales, engineering, operations, and service can use the same evidence without arguing over whose version of the journey is correct.
Machine Shop and OEM Journey Map Examples
A Midwest job shop initially mapped its journey in three stages: RFQ submitted, quote delivered, and order won or lost. That map matched the sales process, not the customer's decision process.
The breakthrough came when the team compared the map with an actual quote that appeared commercially sound but disappeared without a clear objection. The buyer who submitted the RFQ wasn't the gatekeeper. A quality engineer reviewed quotes in a shared spreadsheet and rejected suppliers that lacked the required quality evidence.
The corrected job shop map
The revised map contained six stages, including a hidden quality gate and a finance stage that appeared only after tooling costs exceeded $80K. The team could now see why the original contact seemed engaged while the opportunity was already failing elsewhere.
The map looked like this:
| Stage | Champion | Technical Evaluator | Quality Gate | Finance |
|---|---|---|---|---|
| Need identified | Submits RFQ | Not involved yet | Not involved yet | Not involved yet |
| Feasibility review | Clarifies scope | Reviews drawings | Checks certification needs | Not involved yet |
| Quote comparison | Requests revisions | Compares process fit | Reviews quality evidence | Not involved yet |
| Hidden approval | Builds internal case | Confirms capability | Accepts or rejects supplier | Reviews tooling exposure |
| Commercial approval | Defends supplier | Supports recommendation | Confirms risk controls | Approves spend |
| Order and handoff | Confirms timing | Releases technical details | Sets inspection expectations | Tracks commercial terms |
The important insight didn't come from the visual design. It came from watching the map fail against a real deal and then asking who had the power to stop it.
The OEM version
An OEM selling automated welding cells found a different failure. Its map showed engineering specification, supplier evaluation, committee approval, and closed won. A deal appeared technically approved, then went dormant between engineering approval and procurement release. That gap lasted 14 weeks, giving competitor representatives time to enter while the internal champion waited for the release process.
The corrected map added procurement preparation, executive business-case validation, funding release, and implementation planning. It also gave sales an owner for each dormant period instead of treating inactivity as neutral.
A map is a hypothesis. A live deal is the test.
Use these examples carefully. They aren't templates to copy blindly. The lesson is to compare your assumed stages with a deal that stalled, then add the roles, gates, and waiting periods your current process ignores.
Tools and Templates Worth Using
The right tool depends on the job you need to perform. A visual canvas helps teams see relationships. A spreadsheet preserves evidence. A CRM records signals and triggers follow-up. No single platform automatically reconstructs anonymous committee behavior or repairs weak data discipline.
Most dedicated journey platforms are designed around B2C-style personas. They can force a single-actor model that hides the engineering, operations, procurement, and executive paths that matter in manufacturing. Test whether a tool lets you show multiple roles moving through shared and separate stages before you commit.
| Tool | Committee Granularity | Manufacturing Templates | CRM Integration | Best Fit |
|---|---|---|---|---|
| Smaply | Strong for layered maps and role lanes | Limited, requires adaptation | Available through connected workflows | Teams needing detailed service and stakeholder maps |
| TheyDo | Strong for journeys, opportunities, and team collaboration | Limited, requires customization | Supports connected product and workflow systems | Marketing teams coordinating multiple journey views |
| UXPressia | Useful for personas, emotions, and touchpoints | General-purpose templates | Integrations vary by setup | Teams documenting buyer experience visually |
| Miro | Flexible, excellent for workshops | General whiteboard templates | Usually indirect | Cross-functional mapping sessions |
| Lucidchart | Clear diagrams and structured process views | General templates, easy to adapt | Indirect or workflow-based | Teams needing a clean visual artifact |
| HubSpot journey builder | Good for known contacts and automation paths | Not manufacturing-specific | Strong within HubSpot | A single marketer already using HubSpot |
| Spreadsheet | High if designed with role and stage fields | Easy to customize | Manual or imported | Evidence collection and early diagnosis |
A practical hybrid stack uses a Lucidchart template for the visual map, a structured spreadsheet for the evidence layer, and your existing CRM for instrumentation. That separation prevents the visual artifact from becoming overloaded while keeping the underlying evidence searchable.
If you're building a broader operating plan, use a marketing roadmap template to assign owners, dependencies, content work, and review dates around the journey.
For a single marketer using HubSpot, start with HubSpot and a spreadsheet. A manufacturing marketing team of three or more should consider TheyDo or Smaply if it can support role-based mapping, evidence capture, and cross-functional collaboration. Machine Marketing also works with industrial firms on strategy, CRM and automation alignment, content, and measurement, but the tool is secondary to the operating discipline.
KPIs and Instrumentation That Make the Map Useful
A map without instrumentation is a presentation. You need metrics that tell you where the journey is healthy, where stakeholders disappear, and where your teams are making assumptions.
Use four KPI families.
Pre-capture signal coverage
Measure the research you can observe before a lead becomes known. Track visits to technical pages, repeated specification-content consumption, search themes, return sessions, event interactions, and dark social clues from sales conversations. You won't identify every anonymous visitor, so the objective is coverage, not false precision.
Committee engagement depth
Count role participation, content co-consumption, technical meetings, procurement involvement, and executive validation. Forrester's buyer-group research emphasizes discovery, decision, and validation across different roles, which supports tracking the committee rather than assigning all activity to one contact. Forrester's Buyer Insights research provides the role-based framing.
Stage velocity
Measure the time between meaningful events, not only the age of the opportunity. Useful signals include the interval between the first technical conversation and RFQ, time from quote revision to procurement review, and the duration of dormant stages. These measurements help distinguish buyer hesitation from internal response delays.
Post-sale adoption
Connect purchase data to implementation, usage, service, and quality outcomes. For a manufacturer, that can include onboarding completion, training participation, first-article acceptance, support requests, repeat orders, and expansion conversations. The map should show whether the promise made during the sale survived contact with operations.
| Journey Stage | Primary KPI | Instrumentation Source | What Good Looks Like |
|---|---|---|---|
| Independent research | Pre-capture signal coverage | Web analytics and search data | Technical interest is visible before inquiry |
| Technical validation | Committee engagement depth | CRM, email, meeting records | Required technical roles participate |
| Supplier comparison | Stage velocity | CRM and quoting system | Waiting periods have owners and next actions |
| Procurement and approval | Consensus progression | CRM, quote records, finance workflow | Commercial objections are documented |
| Implementation | Adoption progress | Service system, ERP, quality data | Handoff milestones are visible |
| Expansion | Repeat demand and advocacy | ERP, CRM, service records | Usage and satisfaction inform future opportunities |
Instrumentation fails when UTM conventions are inconsistent, trade show leads enter without source detail, or engineering feedback never returns to marketing. Create one reporting layer that connects marketing automation, CRM activity, ERP quoting, and shop-floor quality data.
For practical measurement definitions and reporting structure, review what marketing analytics means. In week one, build four dashboards:
- Research dashboard: Technical content, search themes, and anonymous engagement
- Committee dashboard: Roles identified, meetings held, and shared content
- Pipeline dashboard: Stage age, dormant opportunities, and quote movement
- Adoption dashboard: Implementation milestones, service signals, and repeat demand
Your 30-Day Starting Plan and What to Do Next
A strong first map doesn't need perfect data. It needs honest evidence, named owners, and enough detail to expose one decision your current process can't see.
Week one, collect the evidence
Interview sales, engineering, operations, procurement, and service. Pull CRM records, quoting history, service tickets, website analytics, and lost-deal notes into one working document. Ask every participant the same questions:
- Who first recognized the problem?
- Who challenged the proposed solution?
- What technical proof did the buyer request?
- When did procurement or finance enter?
- Where did the customer wait?
- What happened after the order?
Don't ask teams to describe the ideal process. Ask them to reconstruct a real purchase.
Week two, draft the role-by-stage skeleton
Use the five-stage framework, then add implementation and adoption. Put committee roles across the top and evidence, content, and KPI fields inside each cell. Mark unknowns clearly instead of filling them with assumptions.
Week three, pressure-test live opportunities
Run the draft against three live opportunities. Look for missing stakeholders, unowned approval gates, unexplained dormancy, and content gaps. If a deal doesn't fit the map, revise the map. Don't force the deal to fit your first theory.
Week four, make it operational
Pilot the map with sales, engineering, and service leads. Assign a KPI owner for each stage, define the CRM fields or activity types that capture signals, and book a 60-day review. The review should answer whether the map helped your team identify risk sooner, involve the right stakeholder, or improve the handoff into implementation.
A weak map is attractive but vague. It lists channels, uses generic stages, and sits untouched after the workshop. A strong map contains evidence from real opportunities, separates roles, identifies loops and waiting periods, assigns owners, and changes what someone does next.
The test: If your inside sales team can't use the map to find one hidden decision or missing stakeholder, it's a document, not a system.
Pick one stalled opportunity today. Walk it through the map with your inside sales team, then time how long it takes to find one decision the team previously couldn't see. That exercise will tell you more than another planning meeting.
Machine Marketing helps manufacturers, machine shops, and industrial business owners connect strategy, content, CRM, automation, and measurement into a working growth system. Visit Machine Marketing to discuss a customer journey diagnosis and turn your first map into an operating plan.