A 2015 McKinsey analysis estimated that 478 billion of 749 billion working hours spent globally on manufacturing-related activities were automatable with then-available technology, equal to 64% of the total, representing the labor equivalent of 236 million of 372 million full-time employees and about $2.7 trillion of $5.1 trillion in labor costs that could be eliminated or repurposed. The same analysis found that 87% of hours in production occupations were automatable. McKinsey's manufacturing automation analysis makes the strategic point clearly: manufacturing process automation has never been limited to buying a robot for one repetitive task.
The harder question is why so many projects still fail to produce dependable results. We've watched manufacturers buy excellent equipment, connect impressive dashboards, and still struggle because the process was undefined, the data was unreliable, the legacy systems couldn't communicate, or operators worked around the new workflow. This roadmap focuses on the decisions that determine whether automation becomes a working production system or an expensive pilot.
Table of Contents
- Why Most Manufacturing Process Automation Projects Stall
- What Manufacturing Process Automation Actually Means
- Core Technologies and Where They Plug In
- The KPIs That Tell You If It Is Working
- A Four-Phase Roadmap for SMB Manufacturers
- What Breaks After the Pilot and How to Pick a Vendor
- Two Short Case Examples With Real Numbers
- Your Next 30 Days and How We Can Help
Why Most Manufacturing Process Automation Projects Stall
The biggest automation failures are usually integration and sequencing failures wearing a hardware costume. A leadership team buys a robot cell or vision system before stabilizing the upstream process, then discovers that the new equipment has inherited inconsistent work instructions, missing material signals, unclear quality decisions, and undocumented exceptions.
That's why automation readiness starts with diagnosis. You need to know who owns the process, how the process runs, which data exists, and which decisions still depend on individual judgment. A machine can repeat a bad sequence with impressive consistency, but it can't decide whether the sequence itself makes sense.
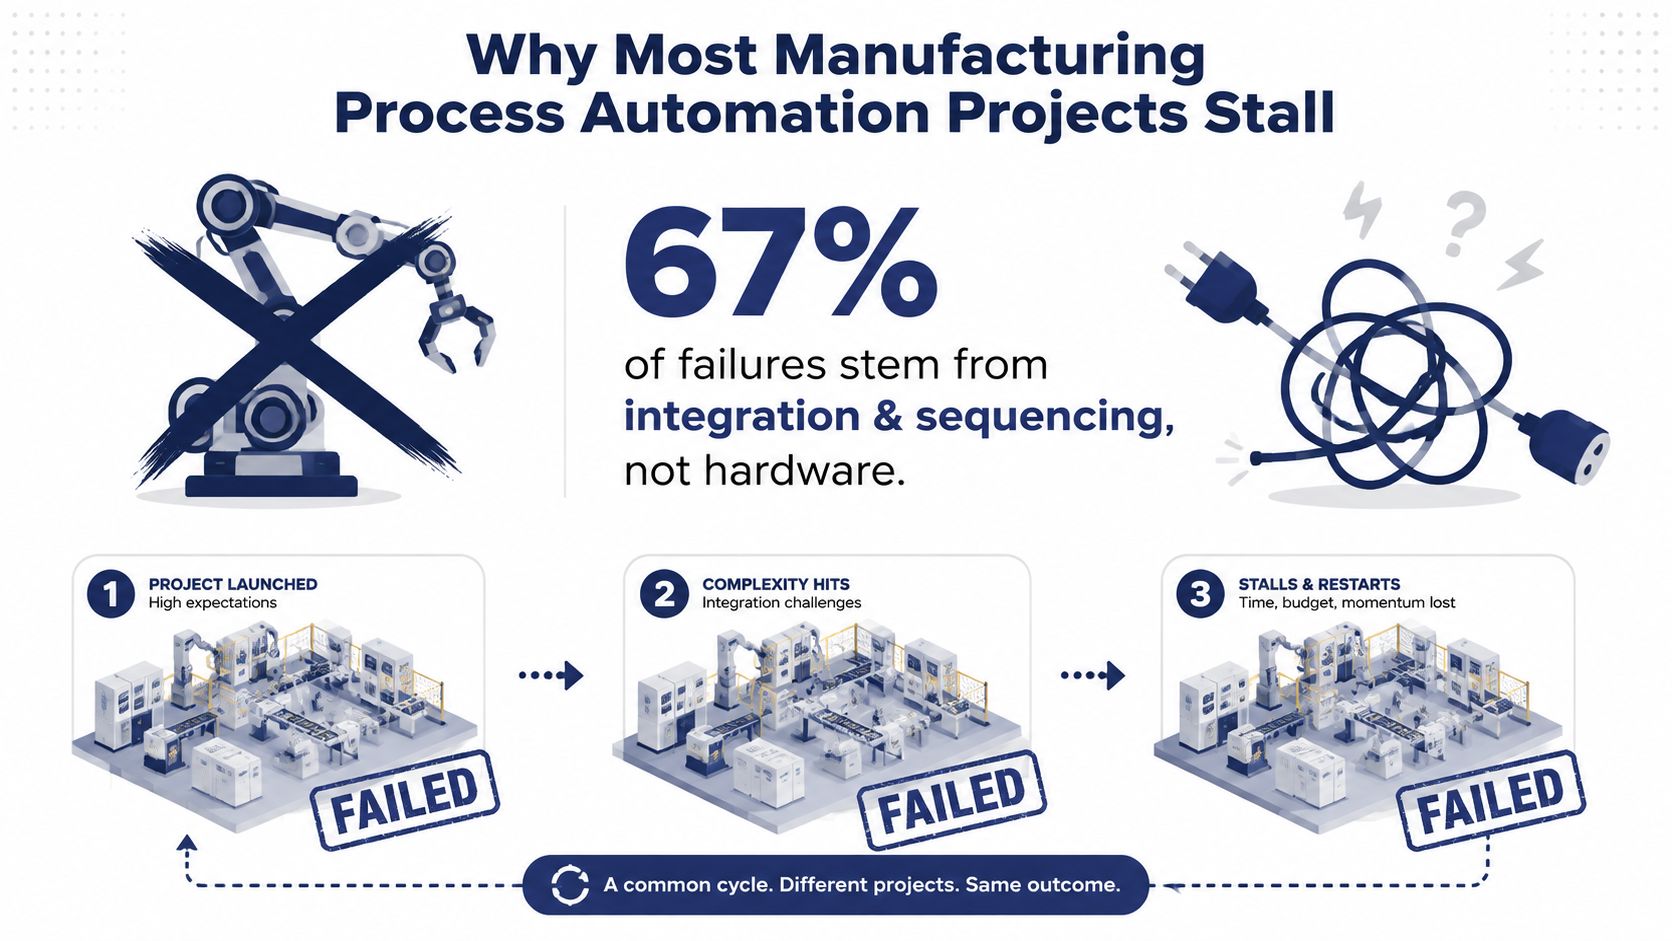
The adoption gap reinforces the point. Modern industrial automation accelerated in the 1960s, when digital computers began supporting real-time industrial applications and the first industrial robots emerged. Yet the 2023 Industrie 4.0 Barometer reported that only 50% of production processes were automated across 899 industrial companies worldwide, while automation reached 44% in companies from the DACH region, the UK, and the USA. The Industrie 4.0 Barometer shows that decades of available technology haven't removed the operational work required for adoption.
The four failure modes to diagnose
- Undefined processes: Teams automate a workflow that exists mainly in tribal knowledge. Exceptions, handoffs, and quality decisions remain undocumented.
- Legacy integration debt: Older machines may not publish the signals an MES, SCADA platform, or analytics system needs.
- Weak KPI baselines: Without an agreed starting point, teams can't distinguish improvement from normal production variation.
- Skipped change management: Operators aren't trained, supervisors aren't accountable, and the new system becomes optional in practice.
Practical rule: If you can't draw the current process, name its owner, and show its baseline performance, you're not ready to automate it.
Treat manufacturing process automation as part of a broader manufacturing digital transformation strategy, not as an isolated equipment purchase. The project should have an operational owner, a data plan, an integration sequence, and a defined handoff to the people who'll run it every day.
What Manufacturing Process Automation Actually Means
Manufacturing process automation is the coordinated use of machines, controls, software, data, and people to execute production with less manual intervention and less discretionary variation. It isn't just “put a robot here.” It's a connected system in which physical actions, production instructions, quality checks, and management decisions reinforce one another.
A useful way to understand the system is to separate it into four layers.
Layer one is physical control
This is the equipment that touches the work. Sensors detect position, temperature, pressure, or presence. Motors, valves, actuators, and robots perform movement. Programmable logic controllers, or PLCs, apply programmed logic so the machine responds to inputs in a repeatable way.
If a press stops because a part isn't present, the sensor and PLC belong to this layer. So does the robot that loads the part.
Layer two is supervisory visibility
SCADA, or supervisory control and data acquisition, sits above individual machines and gives supervisors a broader view of a line, cell, or process area. It can show equipment states, alarms, trends, and operating conditions.
SCADA answers, “What's happening right now?” It doesn't replace the detailed production and business context held in an MES or ERP system.
Layer three is execution
The Manufacturing Execution System, or MES, turns work orders, routings, labor information, quality instructions, and production status into the live execution record. It can tell the line what should be produced, which routing applies, what checks are required, and what happened.
Paperless instructions, genealogy, traceability, and electronic records become operational rather than aspirational.
Layer four is analytics and decisions
Analytics combines MES, ERP, quality, maintenance, and production data so managers can decide what to change. The value isn't the dashboard itself. The value comes from connecting a visible problem to a specific action, such as changing a maintenance window, revising a setup sequence, or redesigning a work instruction.
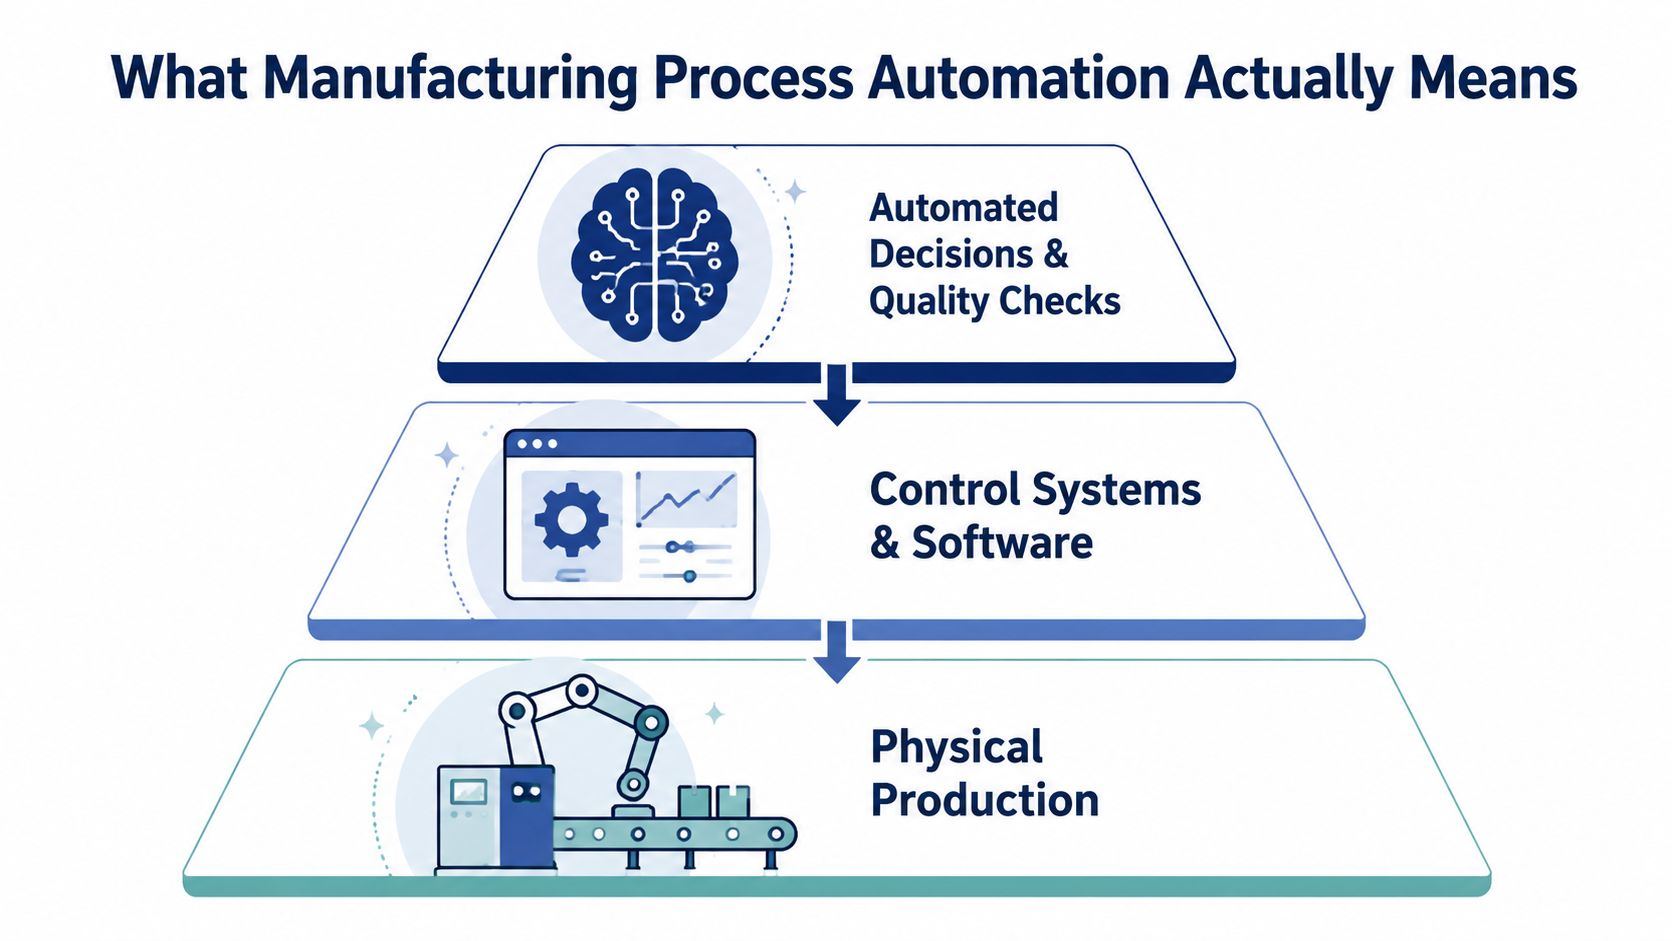
If you want a deeper explanation of how software coordinates control decisions, the advanced process control software guide from Forge Reliability is a useful technical resource. The key test remains simple: can your systems exchange the information needed to move from physical action to accountable decision?
Core Technologies and Where They Plug In
Don't start with vendor demonstrations. Start with the production problem. A PLC, MES, machine vision system, or collaborative robot only creates value when it addresses a defined constraint and connects to the rest of the operating system.
| Technology | Production Problem Solved | Automation Layer |
|---|---|---|
| PLCs | Coordinate sensors, motors, valves, and machine logic in real time | Physical control |
| Industrial robotics | Perform repeatable handling, welding, assembly, or machine tending | Physical control |
| SCADA | Provide supervisory visibility, alarms, and trends across equipment | Supervisory control |
| MES | Manage work orders, routings, instructions, labor records, and traceability | Execution |
| Industrial IoT sensors and edge gateways | Add data collection to older equipment without replacing every machine | Physical control and supervisory control |
| Machine vision | Inspect parts, detect defects, and verify presence or orientation inline | Physical control and quality execution |
| Collaborative robots | Support flexible, repetitive tasks where human interaction and adaptability matter | Physical control |
| Analytics platforms | Turn MES, ERP, quality, and equipment data into decision-ready performance views | Analytics |
The table is a map, not a shopping list. If your primary problem is unexplained downtime, adding machine vision won't solve it. If your problem is paper-based routings and weak traceability, a new robot may increase output without fixing execution discipline.
Cloud infrastructure can support distributed data, applications, and collaboration, but it should follow a clear operational architecture. A practical guide to cloud for manufacturers can help you evaluate hosting, security, support, and connectivity before moving production data into a cloud environment.
What SMB manufacturers should postpone
We'd usually delay a fully custom robotics cell when the process still changes frequently or the work instructions aren't stable. We'd also avoid a heavyweight AI platform if the plant can't reliably capture the underlying production, quality, and downtime data.
Start with retrofit sensors, better work instructions, targeted MES functions, a focused vision inspection, or a simple mechanical aid when those options solve the constraint faster. For related process design ideas, review the workflow automation resources and apply the same discipline to shop-floor handoffs.
The KPIs That Tell You If It Is Working
An automation project doesn't need twenty metrics. It needs a small scorecard that changes what someone does each week.
Overall Equipment Effectiveness, or OEE, is the headline measure because it combines availability, effectiveness, and quality ratio. ISO 22400-2:2014 defines OEE as Availability × Effectiveness × Quality ratio, expressed as a percentage, and allows it to apply to a work unit, work centre, or larger production area.
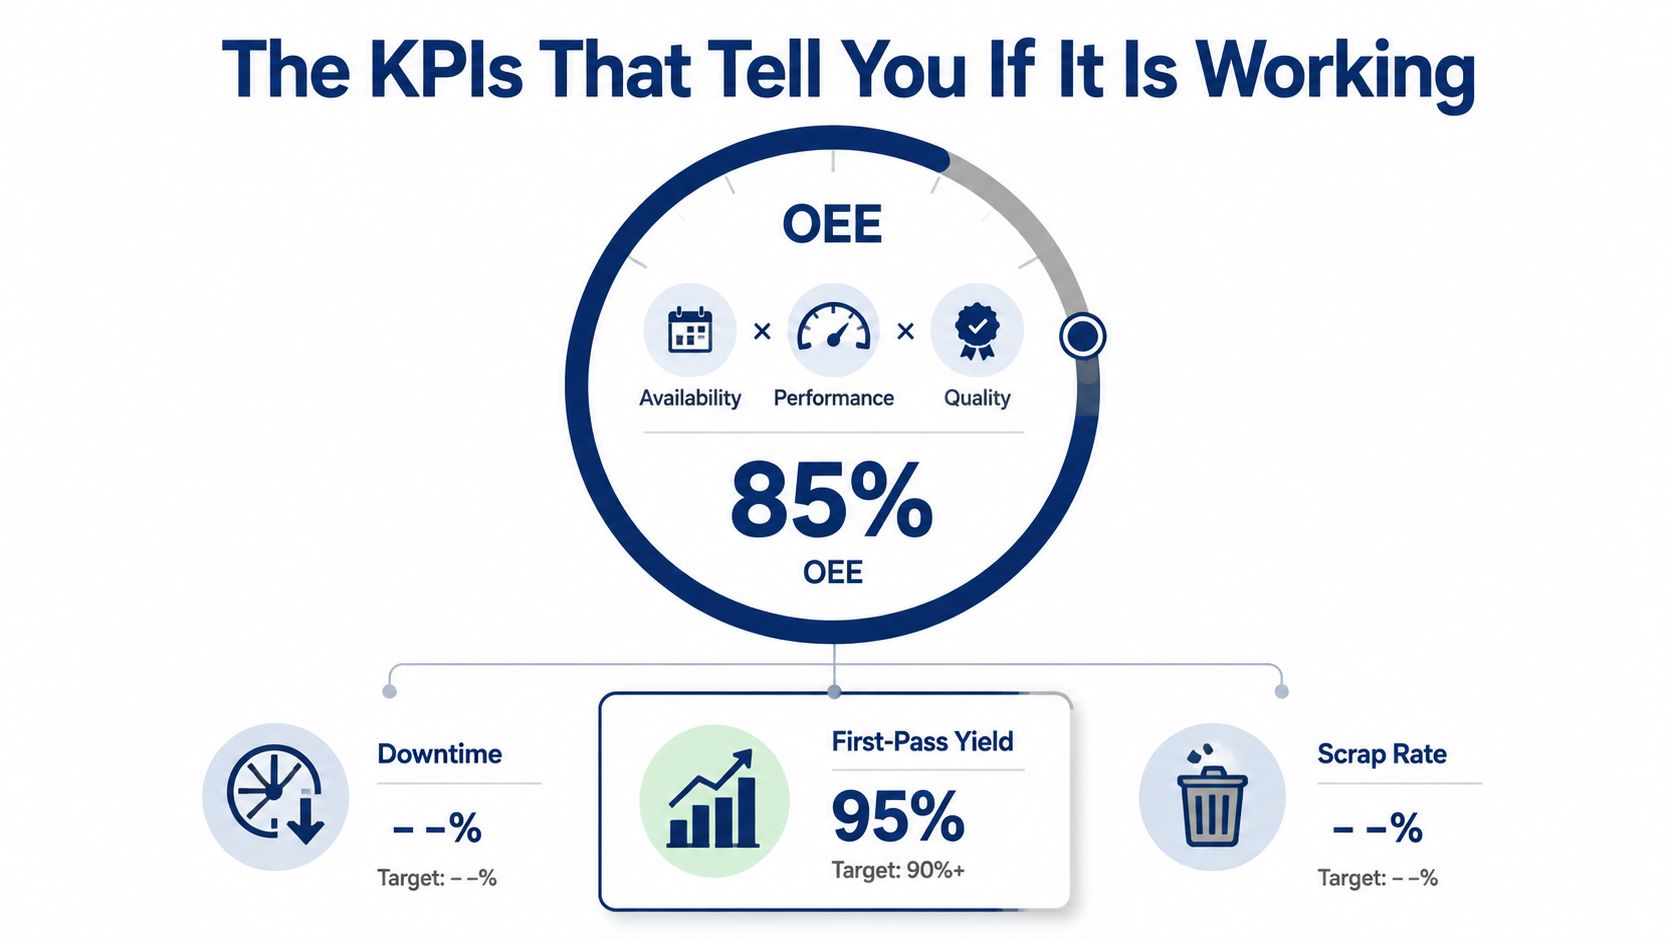
Use each KPI to force a decision:
- OEE: Decide which line deserves the next improvement effort and whether the current constraint is availability, speed, or quality.
- First-pass yield: Escalate defects that are escaping the process before they become rework, scrap, or customer risk.
- Changeover time: Decide whether smaller production lots can become economically viable and where setup work needs standardization.
- Unplanned downtime by cause: Choose the next maintenance action, retrofit, spare-parts decision, or equipment replacement.
The MES stamping case documented in this SSRN study shows why measurement design matters. MES timestamps tracked changeovers and standard operating procedure adherence, contributing to a 37.5% reduction in changeover time, an OEE improvement from 47.17% to 72.36%, and a defect-rate reduction from 8.22% to 1.93% by month 7. The study also reported a monthly OEE increase of 4.29%, with p < 0.001 and R2 = 0.916.
Build one weekly scorecard
Keep the scorecard to one page. For each metric, include the baseline, current result, owner, cause category, and next action.
Avoid vanity measures such as machines connected, dashboards launched, or sensors installed. Those figures describe project activity, not business impact. Your scorecard should answer whether the plant can produce more reliably, with fewer defects, shorter setups, or less lost time.
A Four-Phase Roadmap for SMB Manufacturers
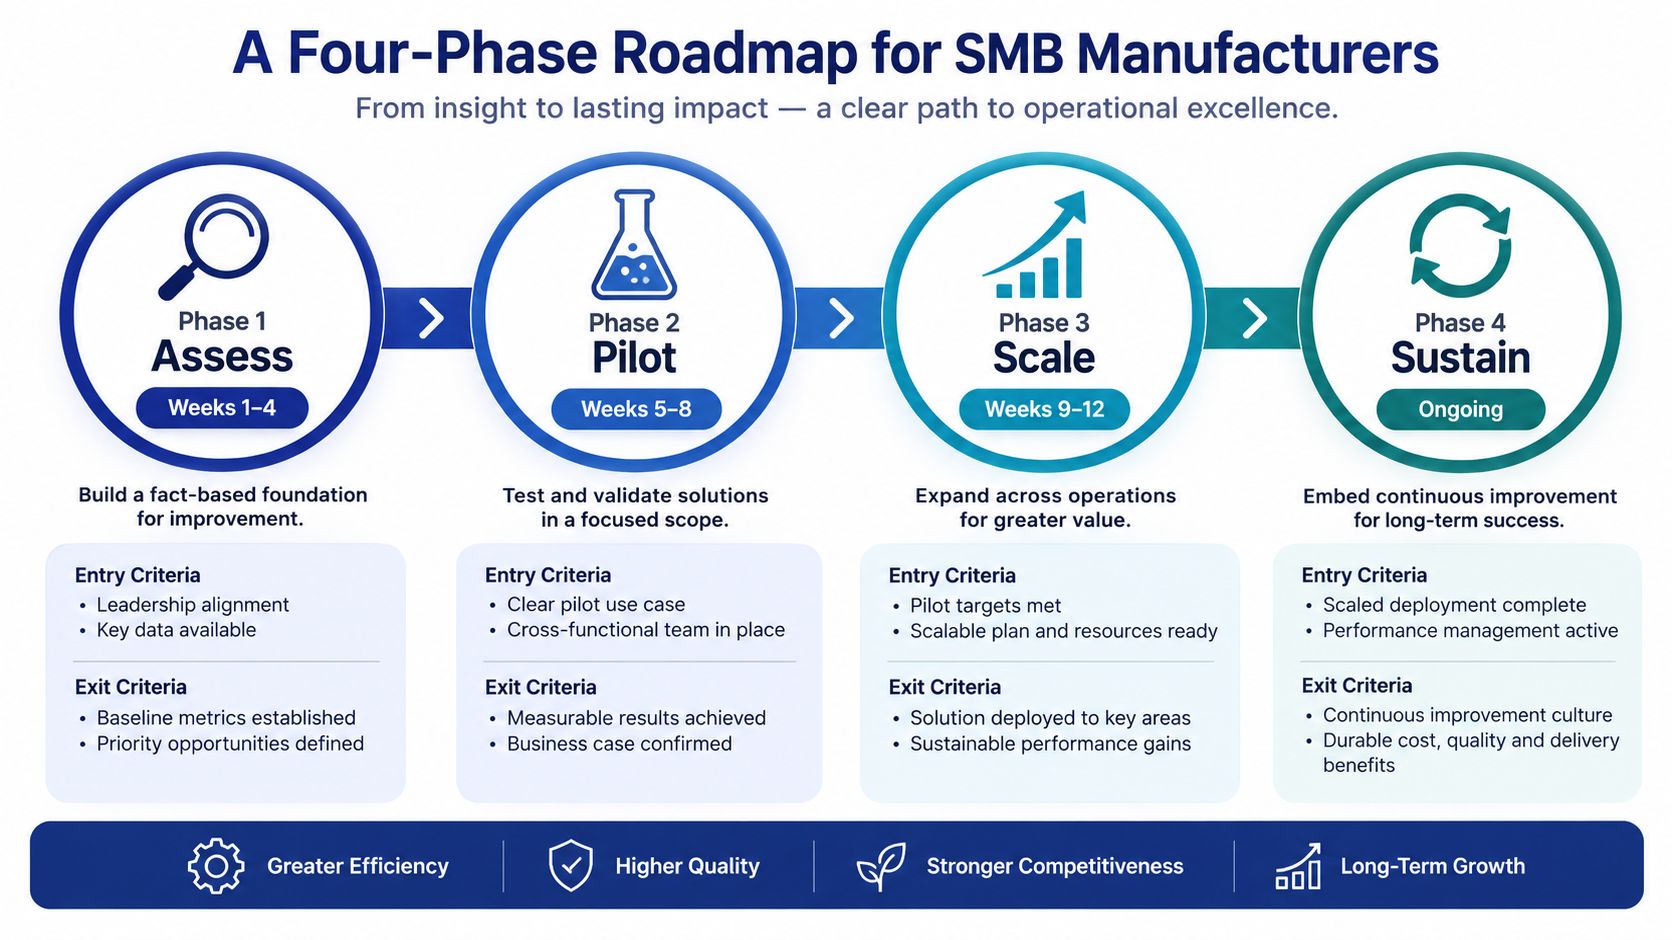
The safest sequence is Assess, Pilot, Scale, Sustain. Each phase needs an entry condition and an exit condition. Without both, teams drift from experimentation into uncontrolled scope.
Assess
Start by mapping the value stream and identifying the constraint that matters commercially. Review downtime, scrap, changeovers, quality holds, labor effort, and customer impact. Rank opportunities by expected value, implementation risk, and time to evidence.
The assessment phase is planned for weeks 1–4. Exit only when you have a one-page business case, an accountable owner, a baseline, and a defined process boundary.
Pilot
Choose one constrained cell or workflow that has a clear problem and a manageable risk profile. Define the success measures before selecting the equipment. Cap the scope and budget, document what the pilot won't include, and involve operators before the installation begins.
The planned pilot window is weeks 5–12. A pilot hasn't succeeded because the demo works. It succeeds when the process performs under normal production conditions, the data is trustworthy, and the operating team can run it without constant vendor intervention.
Scale
Scaling is a standardization exercise. Create a reusable data model, integration pattern, alarm structure, work-instruction format, and training package. Train the second wave of operators before adding more equipment, not after problems appear.
The roadmap places scale in months 4–9, but the calendar matters less than readiness. Don't scale a process that still depends on one engineer's memory.
Sustain
From month 10 onward, operations should own the system. Retire shadow spreadsheets, review the KPI scorecard, audit work instructions, maintain the equipment, and create a process for approving changes.
Use this roadmap as a working sequence, not a promise that every project follows the same calendar.
The temptation to skip assessment or compress the pilot is expensive. That's where SMB budgets most often lose discipline, because the team starts buying capability before it has proved the operating model.
What Breaks After the Pilot and How to Pick a Vendor
A working pilot isn't a working plant. The demo usually runs inside a clean boundary, with prepared parts, available experts, and a vendor team close by. Production introduces exceptions, mixed priorities, maintenance interruptions, old equipment, and operators who need the new workflow to make sense under pressure.
Three breakdowns appear repeatedly.
The first is process exposure. The automation reveals that upstream material presentation is inconsistent, downstream inspection is unclear, or the definition of a completed job differs by shift. The vendor can't fix an ownership problem that the plant hasn't resolved.
The second is legacy integration. The older machine may run reliably but provide no usable data interface. The MES expects a signal that the equipment can't publish, so teams create manual workarounds and undermine traceability.
The third is operator bypass. If operators weren't consulted or trained, they'll route around the system to keep production moving. That behavior isn't resistance for its own sake. It usually indicates that the new workflow adds friction or fails to reflect the job.
| Selection Criterion | Failure It Prevents | Question to Ask the Vendor |
|---|---|---|
| Documented integration plan | A feature-rich system that can't connect to existing equipment | Which machines, signals, software interfaces, and data gaps are included in the plan? |
| Legacy retrofit evidence | An installation that works only with modern equipment | Can you show a comparable retrofit and explain what required custom work? |
| Named change-management responsibilities | Operators and supervisors being left out of adoption | Who owns training, SOP updates, floor support, and escalation after go-live? |
| Post-launch support model | A plant being abandoned after installation | What support will you provide during the first 90 days after go-live? |
| Scope-control process | Budget and timeline erosion through additions | What will you explicitly exclude from the pilot? |
Use the same discipline you'd apply to a business-system rollout. A practical CRM implementation guide reinforces the principle that ownership, workflow definition, data structure, and adoption matter as much as software selection.
Choose vendors who will say no to scope creep. The vendor who narrows the project to a shippable outcome is usually safer than the vendor who promises to automate everything.
Two Short Case Examples With Real Numbers
Short, anonymized examples are more useful than polished vendor stories when the operating choices are transferable. The two examples below illustrate the same principle through different technologies: define the process, instrument the bottleneck, then automate the constraint.
MES-driven stamping line
An MES-driven automotive stamping case used timestamps to track changeovers and adherence to standard operating procedures. The project produced a 37.5% reduction in changeover time, improved OEE from 47.17% to 72.36%, and reduced the defect rate from 8.22% to 1.93% by month 7. The published case study also reported a statistically significant monthly OEE increase of 4.29%, with p < 0.001 and R2 = 0.916.
The important choice wasn't just installing MES software. The team connected measurement to setup control, SOP adherence, traceability, and production decisions. That integration allowed managers to see where time and quality were being lost instead of debating symptoms.
Low-cost karakuri assembly improvement
A lean-karakuri implementation addressed repetitive nut picking with a simple mechanical solution rather than a full robotic cell. Nut-picking time fell from 3.0 seconds to 1.5 seconds per cycle, a 50% cycle-time reduction, while loose-nut defects fell from four per month to zero. The IRJET case shows how gravity, levers, and controlled presentation can remove operator variability at a repetitive station.
| Dimension | Stamping Line, MES | Assembly Cell, Karakuri |
|---|---|---|
| Primary constraint | Changeover control, traceability, and defect visibility | Repetitive part picking and loose-nut defects |
| Solution type | Software-enabled execution and measurement | Low-cost mechanical handling |
| Measurement hook | OEE, changeover time, defect rate | Cycle time and defect count |
| Main lesson | Instrument the process before expanding automation | Use the simplest mechanism that removes the variation |
Both cases started with one bottleneck and a measurable outcome. Neither required a plant-wide transformation before proving value.
Your Next 30 Days and How We Can Help
Treat the next month as an assessment sprint with a clear handoff into a controlled pilot. You don't need a giant transformation program to make the first decision. You need reliable evidence from one line, one process, and one accountable owner.
Days 1–5, assess the problem
- Pull operating data: Gather the last quarter's downtime and scrap records, then separate causes rather than combining every loss into one total.
- Choose one line: Select the line where the constraint affects delivery, quality, capacity, or margin.
- Write the problem statement: Describe the current condition, the business consequence, the process boundary, and the target result on one page.
Days 6–15, find the constraint
Walk the line with an operator, supervisor, maintenance lead, and quality representative. Time the major steps, document handoffs, identify manual decisions, and locate the single bottleneck that limits flow.
Rank candidate solutions by cost, integration effort, operator impact, and time to evidence. Include simple mechanical aids, better standard work, and data collection alongside robotics and software.
Days 16–25, pressure-test the pilot
Ask vendors for a documented scope, integration plan, reference calls, data requirements, training responsibilities, and exit criteria. Reject proposals that describe features without explaining how the system will run within your existing process.
Keep the pilot narrow. Define what success looks like, what happens if the target isn't reached, which data proves the result, and who can approve scope changes.
Days 26–30, prepare ownership
Secure an executive sponsor, assign one internal owner, schedule a 60-day pilot review, and publish the first version of the weekly scorecard. Give operators a clear route to report friction, defects, missing signals, and workarounds.
The role of an outside operations advisor is to compress this diagnosis, force honest scope cuts, and keep the pilot accountable when internal politics start expanding it. That engagement can be phase-specific. You may need process mapping and vendor evaluation now, integration oversight during the pilot, or a later review of adoption and KPI performance. You don't need to sign a multi-year contract to make the next decision correctly.
Manufacturing process automation works when you treat it as a system of process definition, data, technology, ownership, and change management. Start with the bottleneck, measure before you automate, and scale only what operations can sustain.
Machine Marketing helps manufacturers connect strategy, workflow automation, CRM processes, and measurable growth systems instead of adding disconnected tools. Visit Machine Marketing to discuss a focused diagnosis for your automation roadmap, pilot scope, or broader digital transformation needs.