If you manage marketing for a manufacturer, you've probably seen this report: a trade show or sales rep gets credited for a closed order, while the technical webinar, search visit, email sequence, and engineering content that started the conversation disappear. That report may be tidy, but it doesn't tell you what created demand or whether your budget is funding the right activities.
Marketing attribution is the decision system that connects those interactions to pipeline and revenue. In this guide, we'll show you how to evaluate attribution models, wire the right data into your CRM, identify where measurement breaks, and combine attribution with incrementality so your next budget decision rests on evidence rather than a platform dashboard.
Table of Contents
- The Attribution Problem Manufacturers Keep Running Into
- Defining Marketing Attribution in Plain English
- Comparing Attribution Models Manufacturers Actually Use
- Data, CRM Integration, and the System of Record
- Why Attribution Breaks in Long B2B Sales Cycles
- KPIs and Incrementality That Move Budget Decisions
- Implementation Checklist and Your First 30 Days
The Attribution Problem Manufacturers Keep Running Into
A machine manufacturer can generate a qualified inquiry through a technical webinar. The engineer may then spend months reviewing specifications, speaking with a distributor, involving procurement, and comparing suppliers before a sales visit helps close the order. If the CRM only records the final interaction, the trade show or salesperson receives the visible credit, while the activity that created the opportunity is missing from the story.
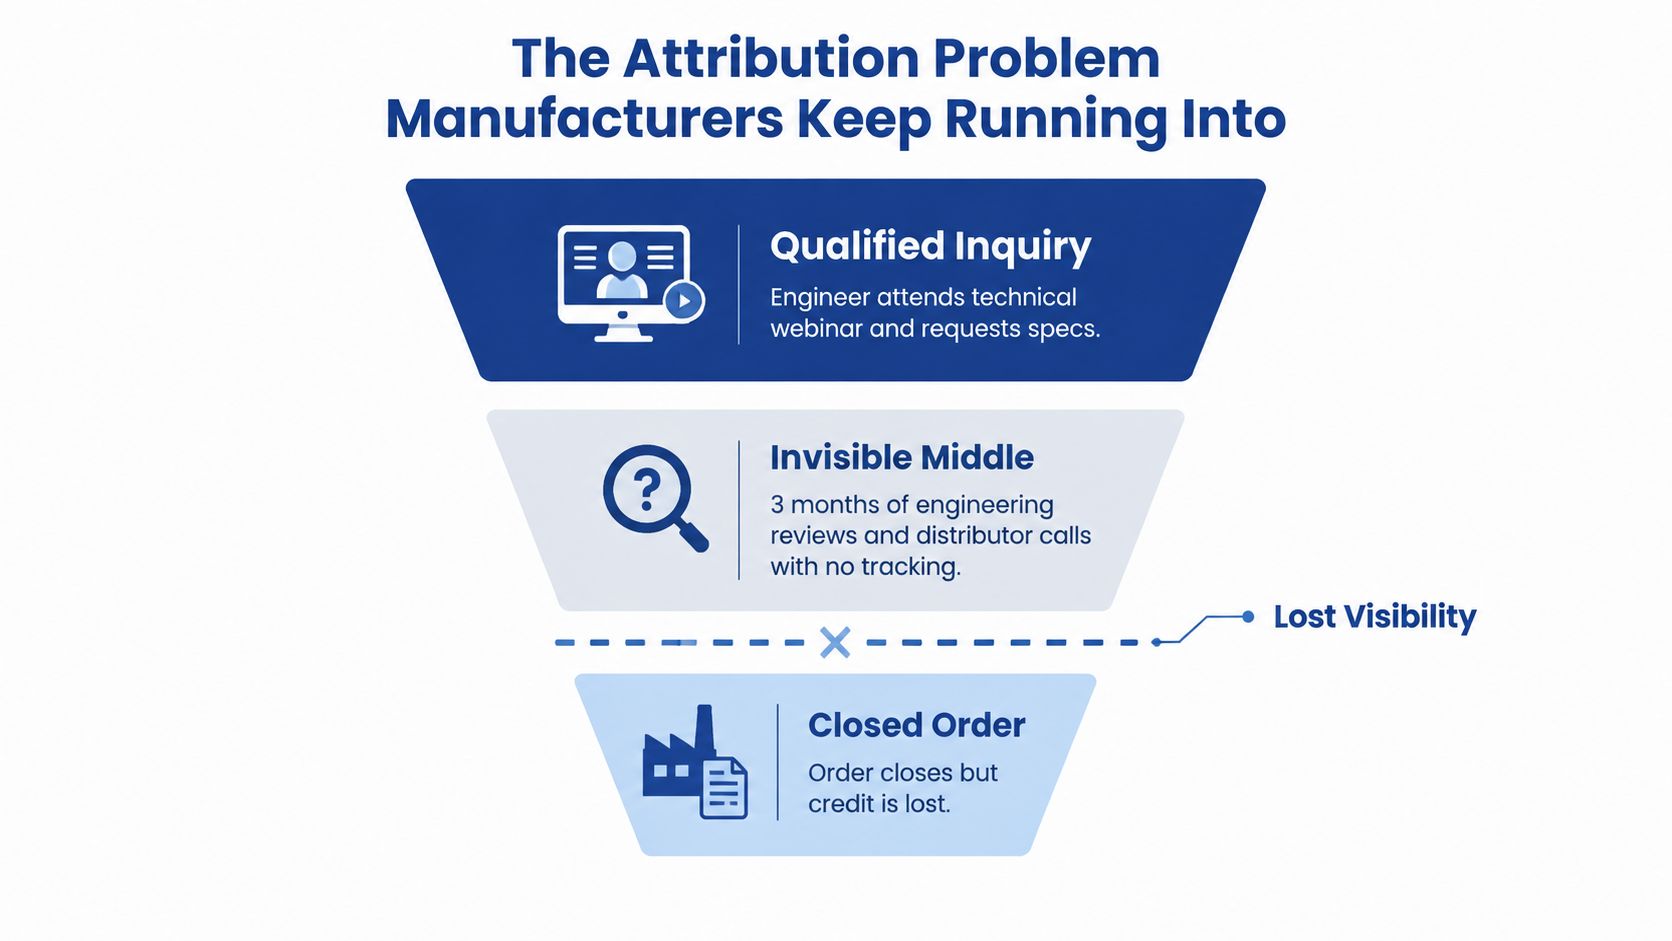
That's the central attribution problem. Manufacturers sell complex products through long, multi-person buying journeys that combine online research, email nurture, phone calls, site visits, distributor activity, trade shows, and procurement events. A browser-based platform sees only part of that path. It may not connect an anonymous technical-page visit to the account that later opens an opportunity, especially when several people use different devices or when the buyer asks a distributor to transact.
Why the final interaction gets too much credit
Most ad platforms still reflect a last-click default-style approach in common workflows. Google Ads documentation explains that last click gives all credit to the final ad interaction, while data-driven attribution distributes credit using observed conversion data. Google Ads also notes that many advertisers are accustomed to measuring success on a last-click basis.
That creates a predictable distortion. Marketing may look ineffective even when it initiated the project, while sales gets credit for an opportunity it helped close but didn't create alone.
What attribution should preserve
A useful system keeps an evidence trail across:
- Demand creation: The first identifiable campaign, search interaction, referral, or content experience.
- Journey development: Web activity, webinar attendance, email engagement, technical downloads, and account-level interactions.
- Commercial progression: Sales calls, meetings, distributor conversations, quotes, opportunity stages, and closed revenue.
The objective isn't perfect certainty. It's a consistent method for comparing programs by qualified pipeline and revenue, not leads alone. Before you debate models, agree on which dataset owns each metric and make sure every opportunity carries a traceable source history.
Defining Marketing Attribution in Plain English
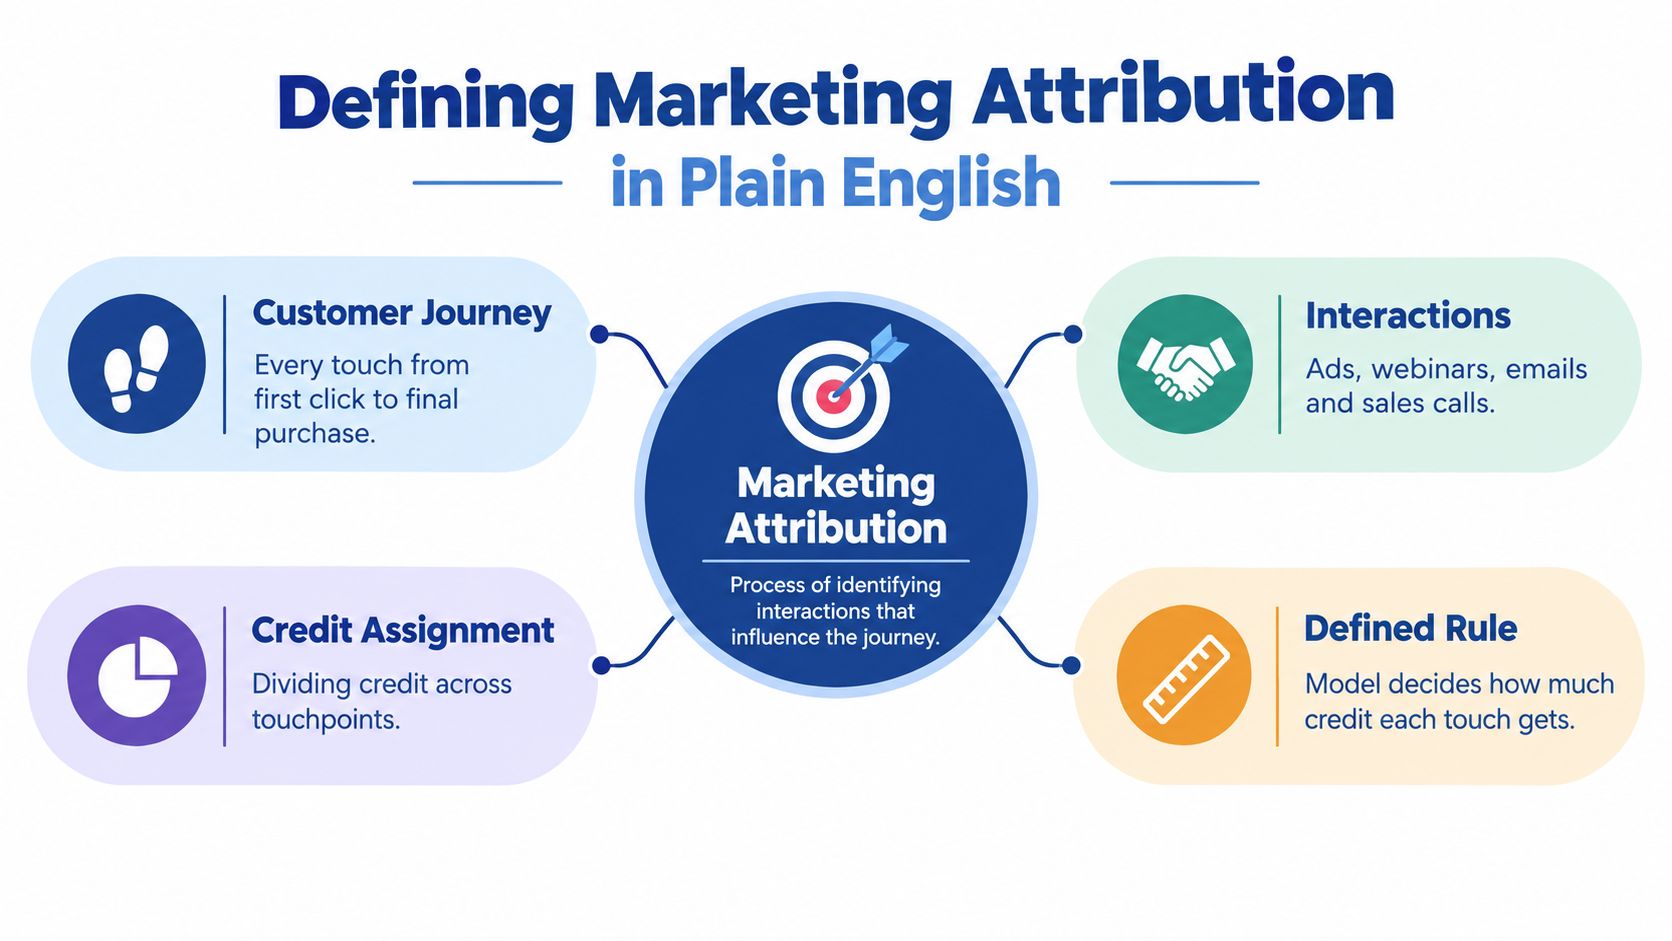
Marketing attribution is the practice of identifying the interactions that influenced a conversion or commercial outcome, then assigning credit according to a defined rule. It's a way to answer a practical question: which activities contributed to this opportunity, and how should that contribution affect our next decision?
Think of a buying journey as a relay race. One touchpoint introduces the manufacturer, another builds technical confidence, and a later conversation helps secure the order. Attribution doesn't prove that one runner caused the finish. It creates a repeatable method for examining how the runners participated and deciding how much credit each receives.
The rule changes the answer
A first-touch model assigns 100% of conversion credit to the first touchpoint, while a last-touch model assigns 100% to the final interaction. The practical definitions and limitations of those models are outlined in this guide to marketing attribution models. Both are easy to calculate, but every other interaction receives no credit.
A multi-touch model spreads credit across several interactions. A data-driven model uses historical conversion behavior to estimate relative influence. Google Analytics documentation states that GA4 uses data-driven attribution by default, with the model individualized to each property and its key events.
Use it to answer operating questions
For a manufacturer, a serious attribution system should help you ask:
- Demand generation: Which programs create qualified opportunities rather than just inquiries?
- Technical evaluation: Does engineering content support progression through the buying process?
- Account quality: Which engaged accounts also produce real pipeline?
- Channel role: Does paid media create new demand, or mostly capture demand already created elsewhere?
- Sales alignment: Which marketing interactions appear before sales accepts and advances an opportunity?
That makes attribution more than a reporting setting. It connects campaign records, website behavior, first-party signals, account engagement, CRM opportunities, and closed revenue into an auditable system. The output is not a declaration that one touchpoint caused a sale. It's a decision framework for allocating budget under uncertainty.
Use the following video as a visual primer before you map your own journey:
Comparing Attribution Models Manufacturers Actually Use
No model fits every manufacturer or every decision. A single-touch model can answer a narrow operational question quickly, while a multi-touch model offers a broader view of a complex journey. The mistake is treating one output as ground truth.
Google Ads deprecated first click, linear, time decay, and position-based models for many conversion actions, upgrading them to data-driven attribution. That shift reflects the wider move from simple single-touch credit assignment toward algorithmic, multi-touch measurement.
| Model | How credit is assigned | Best manufacturing use | Main limitation |
|---|---|---|---|
| First touch | All credit goes to the first identifiable interaction | Evaluating demand creation and awareness sources | Ignores technical content, nurture, sales follow-up, and later influence |
| Last touch | All credit goes to the final interaction before conversion | Reviewing closing actions and operational handoffs | Overcredits trade shows, quote requests, branded search, or final sales contact |
| Linear | Credit is divided equally across recorded touchpoints | Establishing a neutral baseline across a visible journey | Treats minor and decisive interactions as equally important |
| Time decay | More credit goes to interactions closer to conversion | Studying late-stage influence in a long evaluation | Can undervalue early demand creation |
| Position based | More weight goes to selected journey positions, usually the beginning and end | Comparing entry and conversion moments | Assumes those positions matter most |
| Data-driven | Credit is estimated from observed conversion patterns | Budget analysis when tracking and conversion volume support it | Can reproduce data bias and needs governance, clean inputs, and scrutiny |
What each model gets right
First touch can show which programs introduce new accounts. Last touch can show what helps a known opportunity take an action. Neither model should decide the entire marketing budget for a complex industrial sale.
Multi-touch models are more useful when buyers encounter webinars, technical pages, email nurture, distributor referrals, meetings, and quotes. Linear attribution gives every recorded interaction equal weight. Time decay emphasizes recent activity. Position-based models emphasize selected milestones. These methods provide more context, but their rules remain assumptions, not proof of causation.
Data-driven attribution can identify patterns that fixed rules miss. It also demands discipline. If your strongest signal is branded search because buyers already know your company, the model may associate that activity with revenue without proving that the search activity created the demand.
Practical rule: Choose the model according to the decision. Use first touch to study demand creation, last touch to inspect handoffs, and multi-touch or algorithmic analysis to inform budget allocation.
For a broader overview of SEO attribution methods, compare how search activity fits into the wider measurement system rather than evaluating SEO through last-click conversions alone. You can also review this framework for cross-channel attribution when several platforms report overlapping interactions.
Compare models against pipeline quality, opportunity progression, closed revenue, and incrementality. If the answer changes dramatically depending on the model, that disagreement is a diagnostic signal. It means you need better data or a controlled test, not a louder argument about which dashboard is right.
Data, CRM Integration, and the System of Record
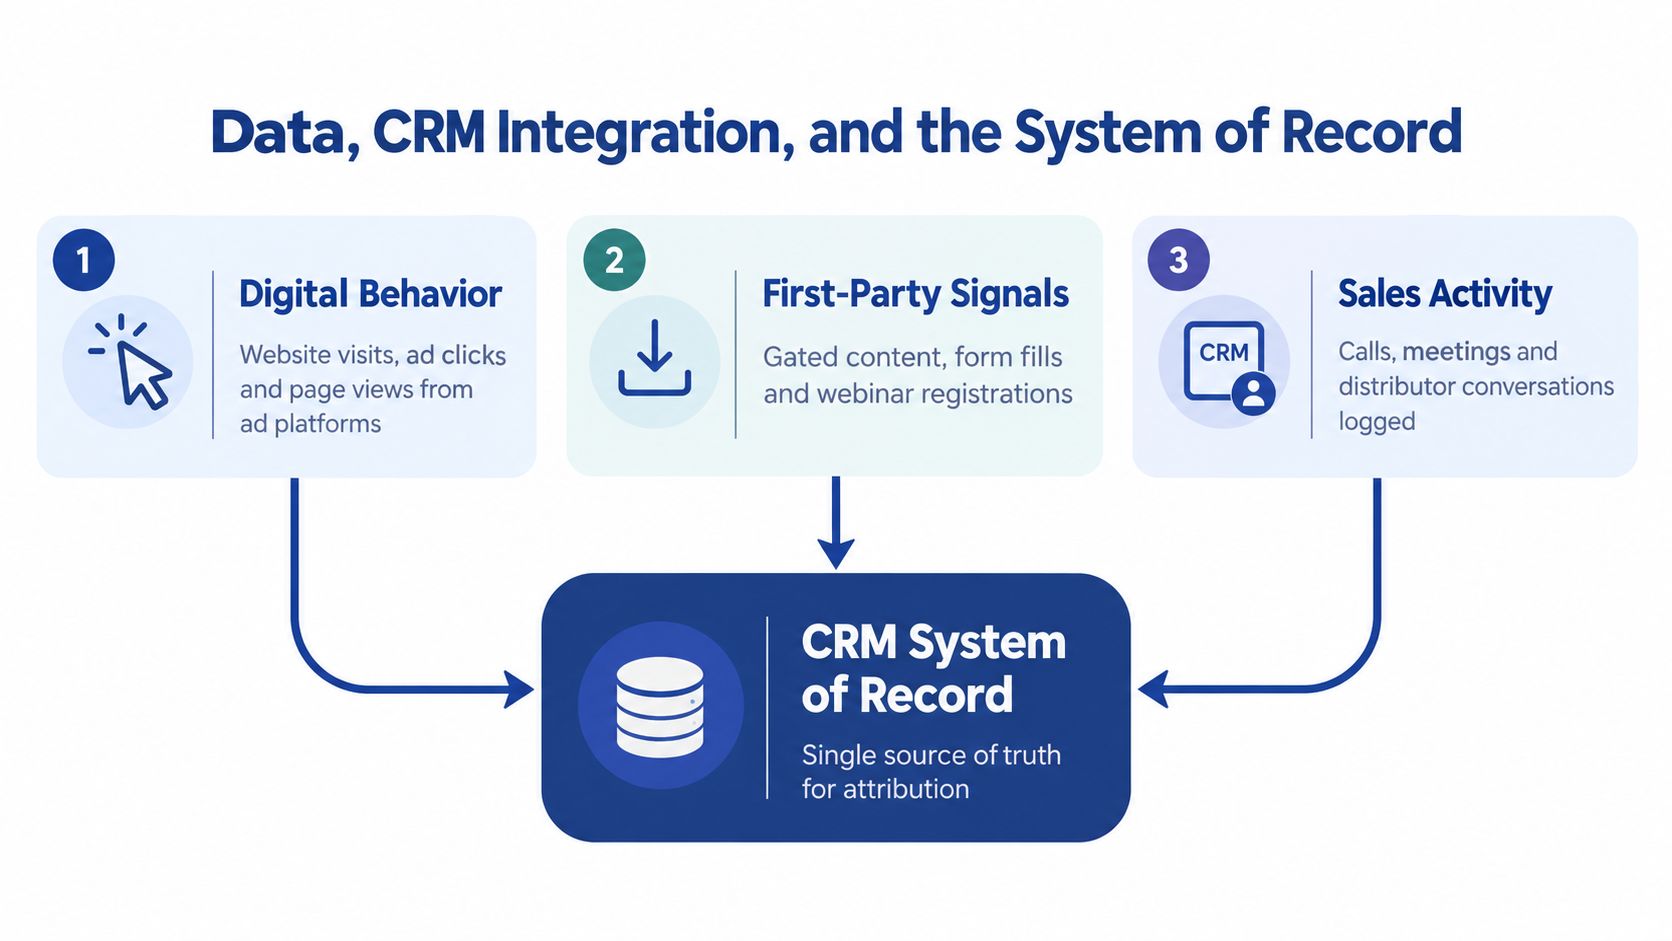
Attribution fails before the model runs if the underlying events aren't defined consistently. Start with three layers of evidence, then decide how each layer enters the CRM.
Build the event layers
Digital behavior includes website visits, ad clicks, landing-page views, and technical-page activity from analytics and advertising platforms. These signals help describe interest, but they often remain anonymous until a buyer completes a known action.
First-party signals include gated downloads, configurator submissions, webinar registrations, quote requests, and form fills. These events create identifiable records and should populate source, campaign, medium, content, and first-touch fields at capture.
Sales activity includes calls, meetings, demonstrations, site visits, distributor conversations, and opportunity notes. These interactions usually carry the strongest commercial context, but they only become measurable when the sales team logs them consistently.
Wire the CRM before polishing the dashboard
When deals close offline, the CRM should own revenue truth. Marketing platforms can report clicks and conversions, but the CRM or order system records opportunity stage, commercial ownership, closed-won status, and actual revenue. A research framework on attribution measurement recommends a system-of-record approach that combines CRM and order data for revenue truth, analytics for consistency, and experiments to correct model bias.
Wire these connections first:
- Form capture to CRM: Preserve original source, latest source, campaign, medium, landing page, and first known date.
- CRM to advertising accounts: Send qualified opportunities and closed outcomes back for closed-loop measurement.
- Marketing automation to CRM: Record content downloads, webinar attendance, nurture activity, and campaign membership.
- Sales tools to CRM: Require calls, demos, meetings, and distributor interactions to attach to the account or opportunity.
- Opportunity governance: Define which fields are immutable, which can be updated, and which dataset owns each KPI.
Your marketing analytics foundation should make those rules visible to marketing, sales, and leadership. Browser-only tracking cannot see an unlogged phone conversation, a private engineering review, or a distributor discussion that uses no shared identifier. The CRM won't solve that automatically. You have to design the handoff and enforce the record.
Why Attribution Breaks in Long B2B Sales Cycles
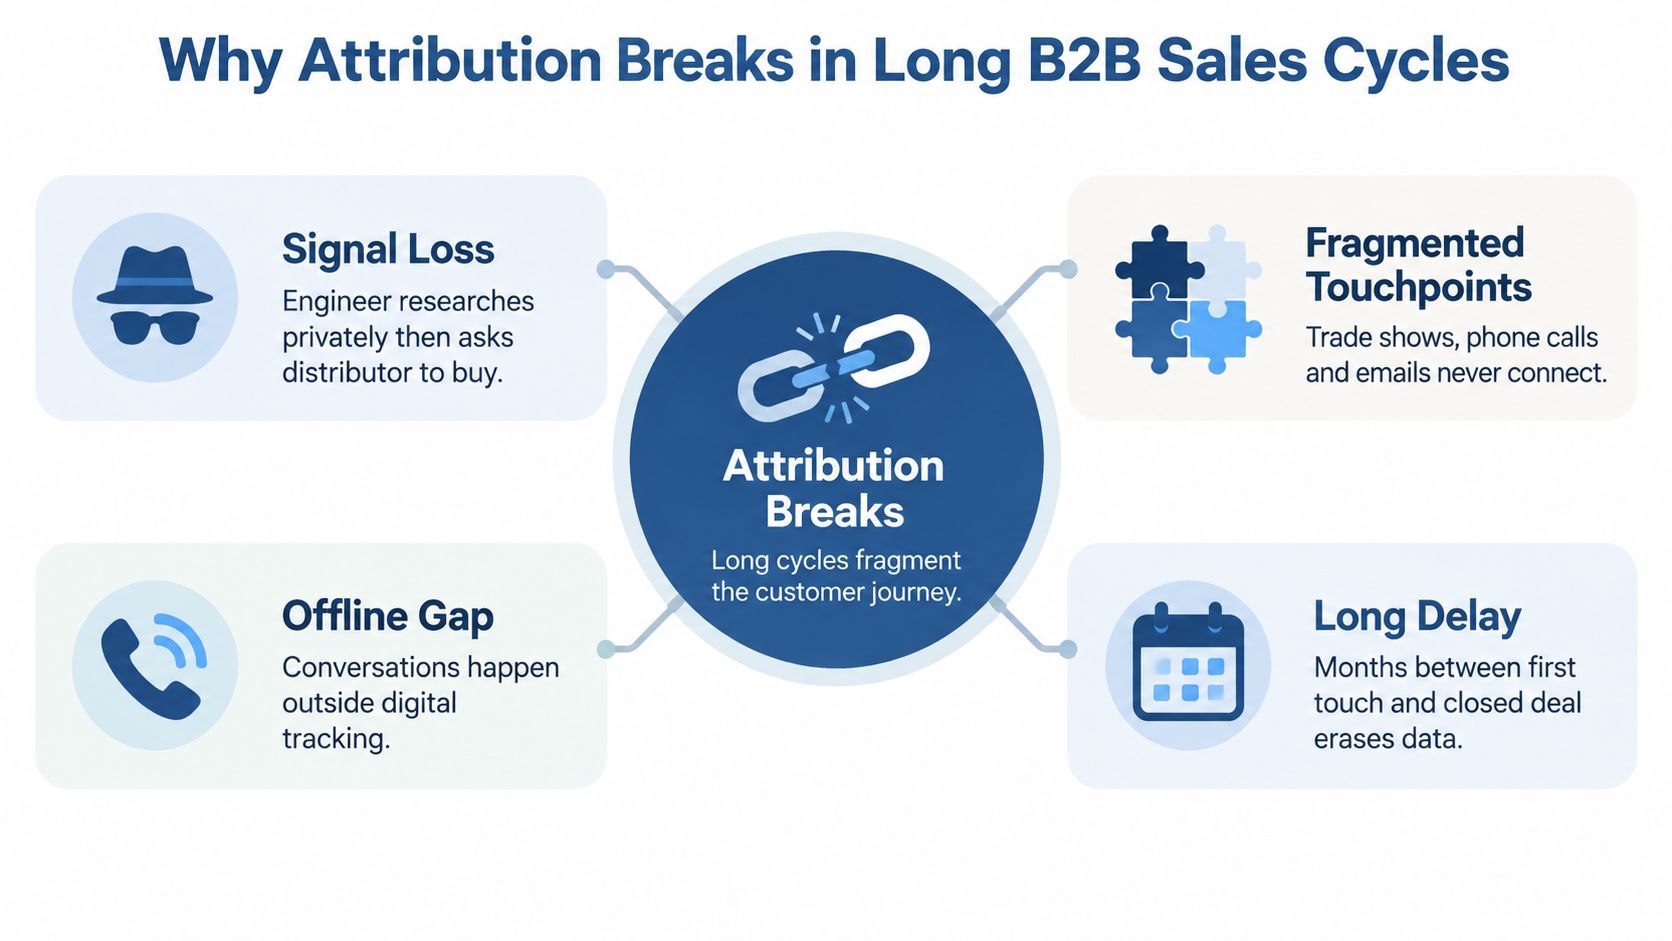
Manufacturing attribution breaks because the journey is distributed across people, systems, and time. An engineer may research privately, share specifications internally, and ask a distributor to purchase. The resulting opportunity can contain a web form from one person, a sales call with another, a distributor record, and a purchase order that carries no digital campaign identifier.
Four failure points to diagnose
Signal loss starts when research happens before identification. Technical pages, product comparisons, and documentation can influence an account without generating a form fill.
Fragmented touchpoints appear when trade shows, phone calls, emails, portals, and sales tools don't share a common account or contact structure. Each system may report a valid interaction, but nobody can assemble the sequence.
Offline gaps are more severe in sales-led manufacturing. A rep's explanation, a plant visit, or a distributor recommendation can change the opportunity without creating a pixel event.
Long delays weaken platform reporting. If the first interaction and closed-won event are separated by months, attribution windows may expire, records may be overwritten, and the original source can disappear before revenue is recognized.
Model disagreement is information
Last click tends to reward branded search, a quote request, a trade show scan, or the rep relationship closest to the close. First touch tends to reward awareness activity while ignoring the technical and commercial work that follows. Multi-touch can correct both distortions, but it can also spread credit so thinly that no program appears accountable.
That creates unavoidable trade-offs:
- Simplicity versus completeness: A simple model is easier to explain, but it omits more of the journey.
- Platform convenience versus CRM truth: A platform dashboard is quick to access, but it may not own offline revenue data.
- Model confidence versus sample size: An algorithmic result may look precise even when the pipeline contains too few comparable outcomes to support strong conclusions.
Recent coverage identifies fragmented journeys, privacy-driven signal loss, and inconsistent platform reporting as major attribution challenges, while Braze's analysis of marketing attribution challenges emphasizes clean unified first-party data and hybrid measurement. For manufacturers, the fix isn't to search for a flawless model. It's to document what each model can see, preserve uncertainty, and validate important budget changes with experiments.
KPIs and Incrementality That Move Budget Decisions
Attribution tells you how credit was distributed. Incrementality asks whether the activity caused additional pipeline or revenue. Those are different questions, and a manufacturer that confuses them can keep funding channels that harvest existing demand.
Start with a KPI chain that follows the commercial process:
| KPI | What it answers | Incrementality lens | Primary data source |
|---|---|---|---|
| Qualified leads | Did the program create relevant inquiries? | Compare qualified demand in exposed and comparable unexposed groups | CRM and campaign records |
| Accepted opportunities | Did sales recognize commercial potential? | Test whether exposure changes opportunity creation | CRM stage history |
| Pipeline velocity | How does an opportunity progress? | Compare progression after a controlled activity or spend change | CRM opportunity history |
| Cost per opportunity | What does qualified pipeline acquisition cost? | Compare cost against incremental opportunity contribution | CRM, media cost, finance data |
| Assisted pipeline share | Which programs participate before conversion? | Check whether assisted presence rises with incremental pipeline | Multi-touch dataset and CRM |
| Closed revenue by source | Which sources connect to booked outcomes? | Validate whether source changes after spend is adjusted | CRM and order system |
Move from credit to causal evidence
A geo holdout can separate comparable regions, with marketing activity restricted in one group and maintained in another. A matched-market test uses similar markets or accounts to compare outcomes when a randomized trial isn't practical. A before-and-after spend shift can provide directional evidence, but it needs careful control for seasonality, sales capacity, product availability, and other changes.
Use attribution to identify candidates for testing. Then ask whether the program creates more pipeline than comparable accounts would have generated without it. Ad effectiveness measurement can help structure that evaluation around business outcomes rather than platform-reported engagement.
Budget question: What would pipeline look like if we stopped this program for one quarter?
Make that question standard in budget meetings. A practical decision rule is to reallocate spend only when a program shows incremental pipeline contribution above its share of total spend. If you can't test a program directly, label the result as directional and avoid presenting attributed credit as causal proof.
Implementation Checklist and Your First 30 Days
You don't need a six-month transformation project to establish a defensible starting point. You need a narrow event schema, clear ownership, and enough discipline to prevent source data from being overwritten.
Week one, diagnose the current system
Audit your CRM, website analytics, advertising accounts, marketing automation, sales tools, event records, and order data. Identify where a contact first becomes known, where an opportunity opens, and where closed-won revenue is recorded.
Define three events that matter most:
- Qualified lead created
- Opportunity opened
- Closed-won revenue
Write a quality rule for each event. For example, a qualified lead needs a valid account, contact, source, and qualification status. An opportunity needs an owner, stage, expected value, and linked account. Closed-won revenue needs a confirmed commercial outcome from the CRM or order system.
Week two, make source data operational
Wire original source, latest source, campaign, medium, first-touch date, and opportunity source into the CRM. Require the essential fields before a new opportunity can advance through the agreed stage, and document exceptions for distributor-led or manually sourced deals.
Don't rely on free-text notes for core attribution fields. Use controlled values, consistent naming, and deduplication rules across client-side and server-side tracking. Assign one owner for data quality and one owner for model governance.
Week three, test a model in shadow mode
Start with position-based multi-touch or a simple time-decay model. Run it against historical closed deals without changing budget, then compare its output with first-touch and last-touch views.
Look for obvious failures:
- Missing sources: Opportunities with no original or latest source.
- Broken identity: Contacts that aren't connected to accounts.
- Overwritten history: Records where the latest campaign replaced the original source.
- Unlogged activity: Sales conversations absent from the opportunity timeline.
- Duplicate events: The same conversion recorded by multiple systems.
Week four, publish and challenge the result
Create a weekly view covering qualified leads, accepted opportunities, pipeline, pipeline progression, assisted pipeline, cost per opportunity, and closed revenue. Tell the sales team what the system can trust and what remains noisy.
Then schedule a quarterly business review to examine budget allocation and define a test for the most important disputed channel. If only one model runs and nobody questions it, the program is too brittle to defend at the next planning meeting. Use multiple lenses, preserve the raw events, and let incrementality tests arbitrate major funding decisions.
Start this week by exporting your current opportunity records and checking whether every open and closed deal has an original source, a latest source, an account, and a stage history. That audit will show you more than another platform dashboard.
Machine Marketing helps manufacturers connect CRM data, campaign activity, sales processes, and revenue into a practical attribution system built for long B2B cycles. Visit Machine Marketing to request a diagnosis of your current measurement stack and identify the first implementation steps worth funding.