
Buying software is popular advice for manufacturing process improvement. It's also an expensive way to avoid diagnosing a stuck order. When quotes slip, jobs wait, and overtime becomes your only response, start with the work, not an AI platform or another machine.
We recommend a narrower approach: identify the constraint, establish trustworthy measures, and test a change the people running the process can sustain. You're looking for reliable delivery and profitable capacity, not a busier-looking factory.
Table of Contents
- Why the Floor Beats a New Software Purchase
- Map One Value Stream and Name the Constraint
- Match Lean Six Sigma PDCA or Kaizen to the Constraint
- Set KPIs and Design a Pilot That Can Pay Back
- Avoid the Pitfalls That Erase Shop-Floor Gains
- Choose One Cell and Start the Thirty-Day Clock
Why the Floor Beats a New Software Purchase
Manufacturing process improvement is an operating system for removing waiting, defects, and broken handoffs so the same crew can ship more good work. Technology can support that system. It can't replace clear instructions, accountable ownership, or reliable counts.
Manufacturers surveyed in Deloitte's 2025 smart-manufacturing survey reported a 10%–20% average improvement in production output after implementing smart-manufacturing initiatives. That's a reported outcome, not a return guaranteed by buying a license. Your improvement still needs a diagnosed problem and a credible implementation plan.
Start with the supervisor's view of the work, including the orders that haven't moved.

Ask What's Missing Before Adding Technology
In a global survey of 183 senior manufacturing AI leaders across eight countries, 56% reported data-related implementation problems and 40% cited workforce challenges, including skills gaps and resistance to change, as described in Deloitte's manufacturing analysis.
For a smaller plant, the practical readiness check is straightforward. Can you trust the scrap count? Does downtime mean the same thing on every shift? Can someone explain how first-pass yield is calculated? Who has authority to change the standard operating procedure, or SOP?
Ask your team:
- Where does this order wait? Include engineering, purchasing, inspection, and shipping, not just machining.
- Which defect repeats across shifts? Look for a recurring condition rather than blaming the last person who touched the part.
- Who can change the standard this month? Name someone with authority, available time, and responsibility for the result.
Missing standard work, an unnamed process owner, and inconsistent baseline measures are reasons to pause a purchase. They're problems to solve before asking sensors or AI to interpret the process.
Practical rule: Don't automate a decision your team can't explain or a count your team doesn't trust.
Make Readiness the Investment Gate
Build your baseline around scrap, downtime, lead time, and first-pass yield. Record each measure consistently, then choose the measures that describe your constraint.
Our recommendation is to map a value stream, select the appropriate method, and run a 30- to 90-day pilot before expanding. Treat that duration as a planning window, not a promise of results.
Use this guide to manufacturing process automation when you can describe the task, its exceptions, and the business outcome you want. Until then, better execution is the purchase you haven't made yet.
Map One Value Stream and Name the Constraint
Walk a product family before choosing a method. A plantwide efficiency campaign gives everyone something to do, but it doesn't necessarily help the order that's already late.
A value stream includes the material and information needed to move a product from order release to shipment. Your sketch should show where people work on the order and where nobody does.
Walk the Order, Not the Department Chart
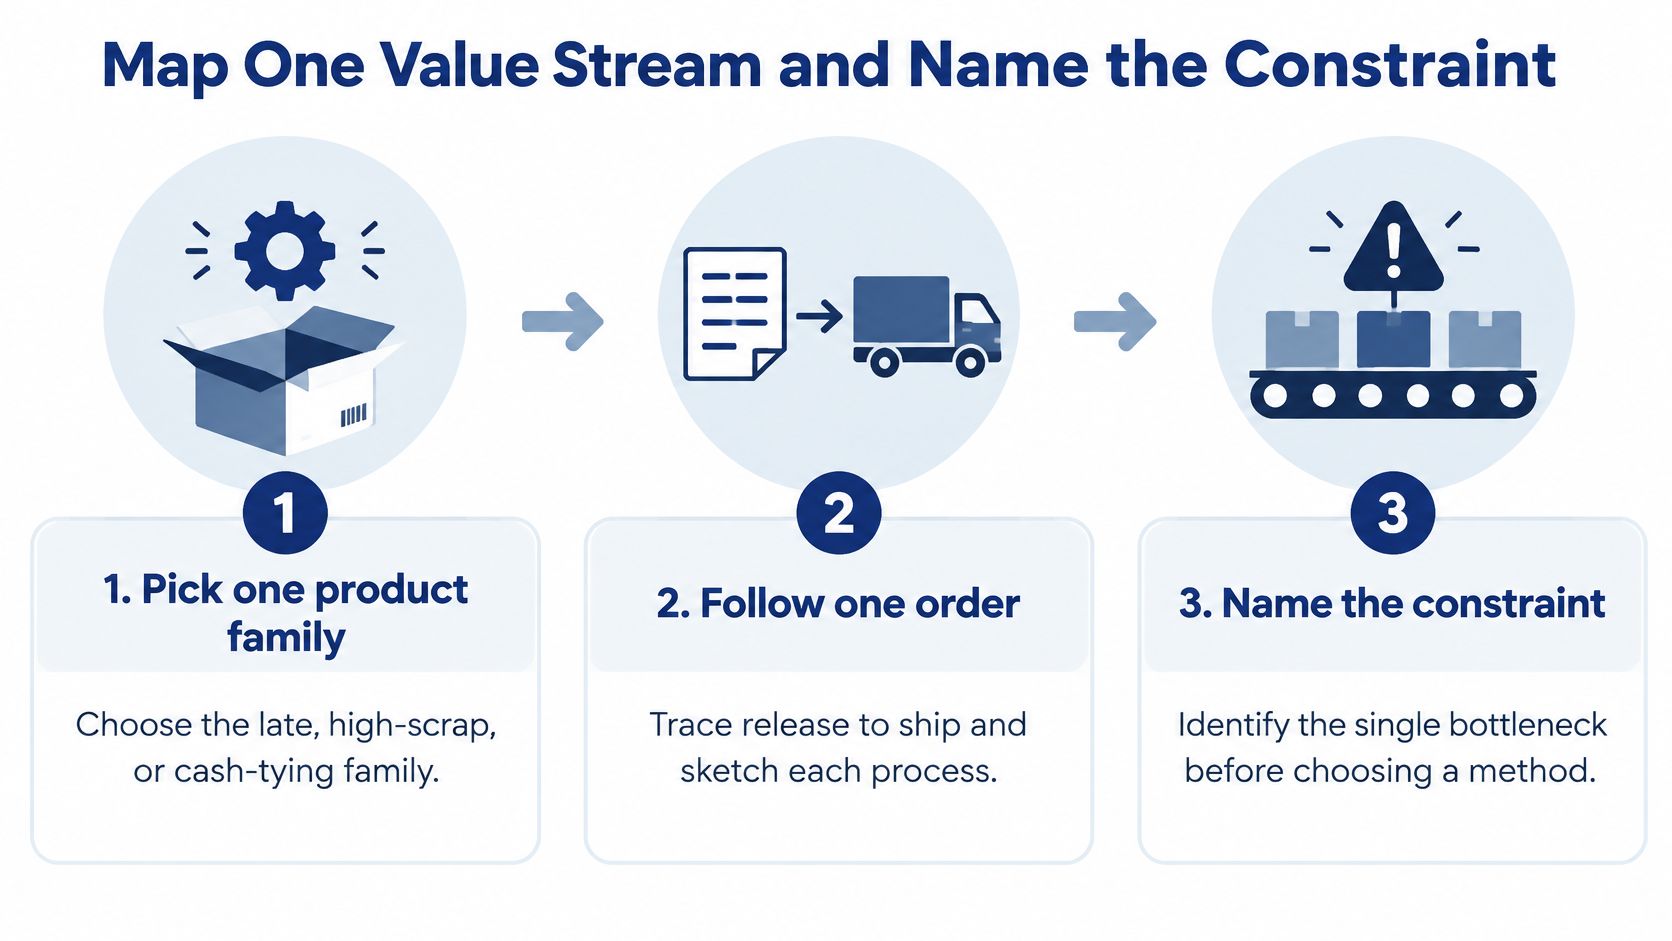
Choose the family that hurts. Pick products with late deliveries, recurring scrap, or cash tied up in unfinished inventory. Don't start with the whole plant or the easiest cell to photograph.
Follow an actual order from release to ship. Draw process boxes for production steps and mark every queue and handoff. Include a drawing clarification sitting in engineering and an inspection release waiting for approval.
Separate work, waiting, and movement. Time these activities independently. A machining cycle doesn't explain how long the job sat beside the machine before anyone loaded it.
Record the baseline without blending measures. Capture production lead time, work-in-process time, waiting time, and travel distance. Add first-pass yield and scrap counts so a faster route doesn't conceal worse quality.
A published lean manufacturing study reported a 23.66% reduction in production lead time, equal to 50.361 hours, after removing non-value-adding activities. It also reported waiting time falling from 133.45 to 83.08 hours, a 37.74% reduction.
The study reported WIP time moving from 196.83 to 146.46 hours, while separately reporting an 8.6% WIP-time decrease. Those figures don't reconcile arithmetically, so don't use that percentage as a planning assumption. Its reported 61.2% reduction in travel distance and 25.59% improvement in process cycle efficiency reinforce the value of measuring different kinds of waste separately.
Name the constraint in a sentence. For example: inspection approval holds completed batches before shipping. That's actionable. Poor efficiency isn't.
Choose only the method that attacks that constraint. A replenishment problem needs a different intervention from an unstable machining dimension. Don't select a tool because someone already has training in it.
Write a one-page problem statement. Include the affected family, baseline, target, owner, scope, and customer consequence. Identify what evidence would disprove your suspected cause.
Use this visual as a reminder of the essential sequence.
Distinguish Capacity From Handling
Say material handlers repeatedly move pallets to reach the next job. A faster machine won't remove that obstruction. You need to examine storage locations, replenishment routes, staging rules, and access.
For that diagnosis, Material Handling USA's warehouse layout guidance for operations managers provides a useful resource for reviewing physical flow. Apply it to the route you've observed rather than redesigning the warehouse from a desk.
Leave the walk with a sketch, separate time measures, a distance measure, and a named constraint. A plantwide 5S cleanup before that point might improve housekeeping, but it won't tell you why the order waits.
Match Lean Six Sigma PDCA or Kaizen to the Constraint
Write the constraint sentence before opening the comparison. Then select the row that matches the problem, not the method with the most impressive certification.
Which method fits the constraint
| Method | Use it when | Core cycle | Skip it when |
|---|---|---|---|
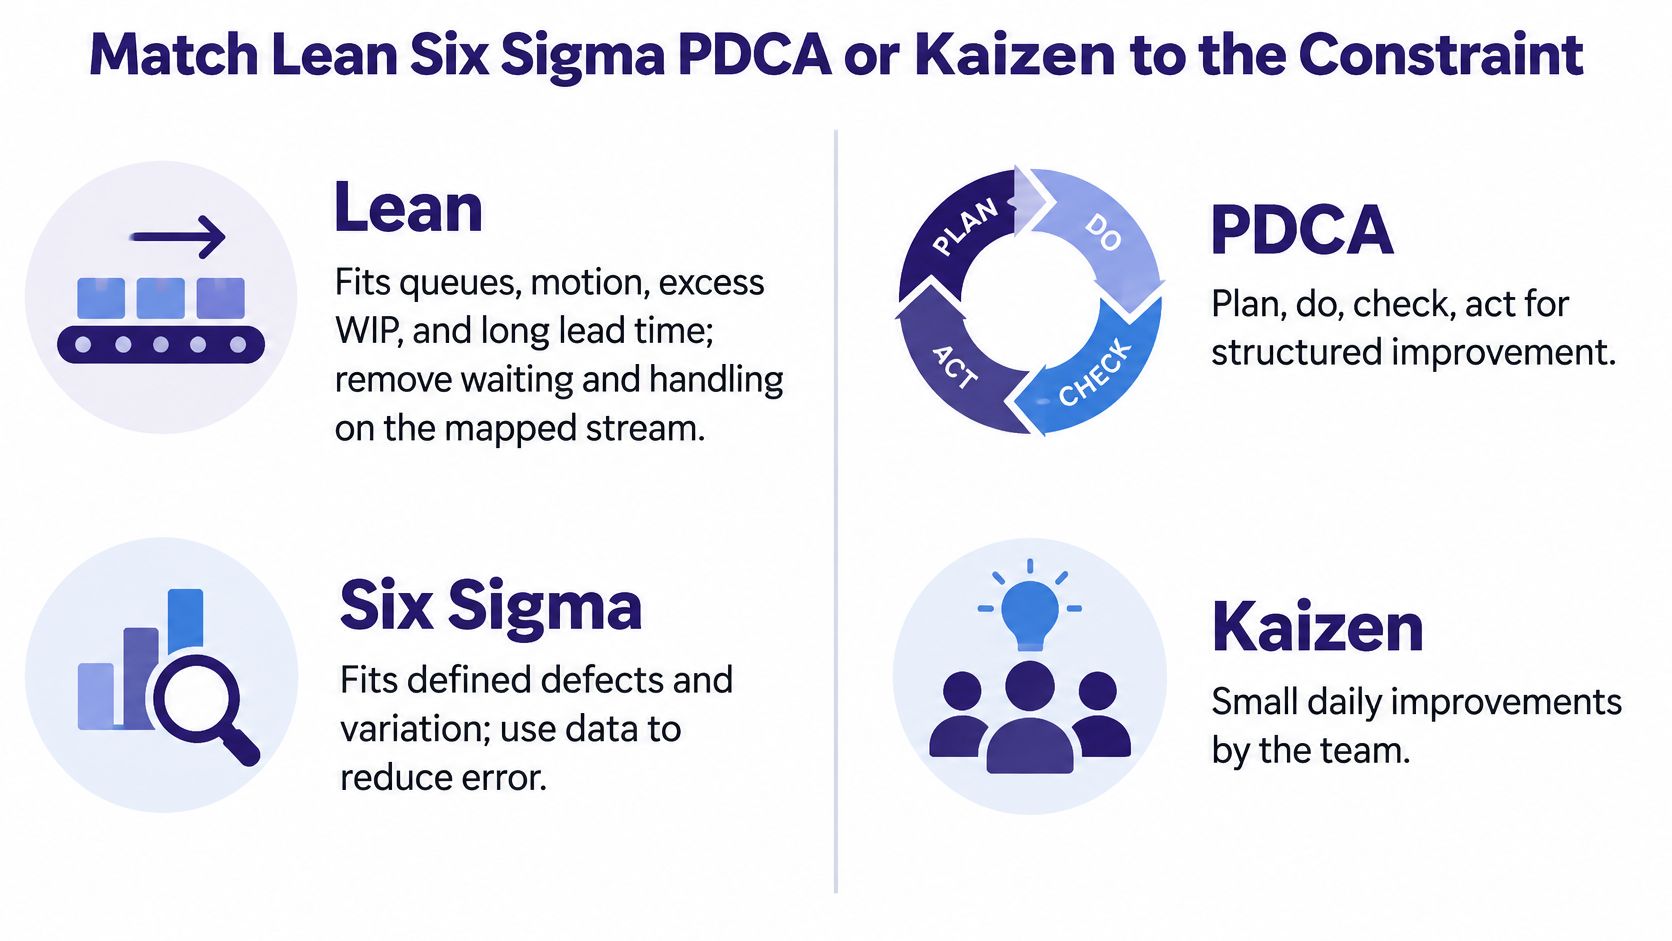
| Lean | Queues, motion, excess WIP, or long lead time | Value-stream map, then remove waste | Flow is already stable and only defect variation remains |
| Six Sigma | Defined defects and process variation | DMAIC | No agreed defect opportunity or baseline |
| PDCA | One cause a supervisor can test this week | Plan, Do, Check, Act | The problem spans many departments and has no data |
| Kaizen | A known waste pile and a team free for 3–5 days | Focused event plus follow-up standard | Leaders won't release operators from the cell |
| Lean Six Sigma | Both flow waste and quality variation on one process | Lean tools inside DMAIC | No sponsor, data owner, or time to control the new standard |
The Kaizen duration is a recommended event format, not a requirement for continuous improvement. Daily team-led improvements still belong in the operating routine.
Use the visual to distinguish the methods before assigning work.
Understand What Six Sigma Measures
According to ASQ's Six Sigma glossary, Six Sigma emerged at Motorola during the 1980s, associated with engineer Bill Smith and CEO Bob Galvin, and uses the DMAIC cycle: Define, Measure, Analyze, Improve, and Control.
Its conventional long-term benchmark is approximately 3.4 defects per million opportunities. The model allows a 1.5-sigma shift, treating short-term six-sigma capability as approximately 4.5 sigma over the long term.
That's a statistical benchmark, not a promise for your shop. Before using DPMO, agree on what counts as a defect and what constitutes an opportunity. Otherwise, teams can change the denominator without improving the product.
Lean addresses time and resource waste; Six Sigma adds discipline for understanding variation. A domestic-appliance manufacturing case study combined them through DMAIC in valve machining and assembly, reporting that the implementation reached its intended flow stage.
Keep the Method Smaller Than the Problem
For a supervisor testing a suspected setup cause, PDCA may be enough. Plan the test, make the change, check the result against the baseline, and either standardize it or revise the hypothesis.
For visible cross-functional waste, schedule a focused Kaizen event only when operators, maintenance, quality, and planning can participate. Don't call a meeting an improvement event if nobody can authorize a change.
Use a consistent problem-solving framework to document evidence and decisions. Don't stack every method on the same cell.
For a team discussion, use this video alongside the constraint sentence and method table.
The selection test is simple: one constraint sentence, one method, one accountable owner.
Set KPIs and Design a Pilot That Can Pay Back
Toyota reports that applying its production system cut average order-to-delivery time from 50 days to 25 days, a 50% reduction, and that kanban management had reached all its plants by 1963, according to Toyota's production-system history.
The lesson isn't to imitate Toyota's scale. It's to connect shop-floor changes to customer-facing outcomes instead of treating machine utilization as the objective.
Baseline Only What Supports a Decision
Use the rows tied to your constraint, plus on-time delivery and first-pass yield. The reference results below describe published cases and benchmarks, not targets your plant should inherit.
Baseline metrics for a manufacturing pilot
| Metric | What to record | Reference result | Decision it drives |
|---|---|---|---|
| Order-to-delivery lead time | Days from order receipt to delivery; track shipment separately | Toyota cut 50 days to 25 days | Whether the plant can promise more work |
| Production lead time | Hours for the mapped family | One study cut 50.361 hours, or 23.66% | Where the project should start |
| WIP time | Hours of in-process inventory | 196.83 hours down to 146.46 hours | Flow problem versus a batching habit |
| Waiting time | Queue hours between steps | 133.45 hours down to 83.08 hours, or 37.74% | True constraint versus idle-looking machines |
| Travel distance | Distance material or people move | 61.2% reduction in the same study | Layout and handling versus machine speed |
| Process cycle efficiency | Value-adding time divided by lead time | 25.59% improvement in the same study | Whether waste removal actually worked |
| Defects per million opportunities | Defect count divided by defined opportunities, multiplied by one million | About 3.4 DPMO is a benchmark, not every plant's target | Quality project versus a flow project |
| On-time delivery and first-pass yield | Percent delivered on promise; percent good without rework at first check | Use the plant's own baseline | Customer retention and margin, not utilization |
Keep measurement boundaries explicit. Order-to-ship and order-to-delivery aren't interchangeable. Neither are machine cycle time and total production lead time.
Bound the Pilot and Calculate Real Payback
Limit the pilot to a cell or product family. Give it a primary metric, a named owner, a review date, and a control that works when the project team isn't present.
Use these calculations:
- Monthly net benefit: Avoided rework labor, scrap, overtime, and other realizable costs, plus contribution margin from additional work you can sell, minus recurring costs.
- Payback period: Implementation cost divided by monthly net benefit.
- Implementation cost: Include event time, fixtures, training, installation, integration, and software, not just the purchase price.
Don't multiply every hour of lead time removed by a labor rate. Queue time isn't necessarily paid labor saved. Released capacity has financial value when you sell it, avoid overtime, or avoid another expense.
This distinction is central to reducing manufacturing costs without claiming savings that never reach the accounts.
Before go-live, ask whether every shift collects the measure consistently, what spending or activity you'll stop if performance improves, and what safety or quality regression would cancel the change.
A pilot that can't name its primary metric is a tour, not an improvement.
Finish with a control packet: a visual standard, check frequency, escalation threshold, and named person who acts when the result slips.
Avoid the Pitfalls That Erase Shop-Floor Gains
Buying the tool first creates an avoidable problem: your team must justify a purchase before proving which loss it should remove. A successful demonstration doesn't establish that the tool addresses your constraint.
An empirical study covering six Italian manufacturing companies associated electronic kanban with reduced lead time at one company, OEE software and real-time monitoring with productivity improvements at three, and inventory tracking with better warehouse management at another. The study also identified employee skills and a specialized implementation team as important deployment conditions.
Match the Tool to the Loss
Use electronic kanban when replenishment signals and material flow need control. Use overall equipment effectiveness, or OEE, monitoring when availability, speed, or quality losses are hidden inside machine time. Use inventory tracking when people can't reliably locate or count material.
Don't install software to make an unreliable count look precise. Confirm the counting rules and assign responsibility for exceptions first.
The workforce challenge is equally practical. Deloitte's 2025 survey found 48% of respondents faced moderate-to-significant difficulty filling production and operations-management roles, 46% reported similar difficulty in planning and scheduling, and 35% named adapting workers to the future factory as a top concern, as summarized in the Manufacturing Leadership Council's survey recap.
Classroom training alone doesn't demonstrate that someone can run the revised process. Have operators perform the work, explain the exception rules, and show when they'd stop and escalate.
Capture Decisions, Not Just Instructions
Before an experienced operator leaves, document how they recognize a developing problem. A photo of the correct setup matters, but so does the reason they reject a fixture, adjust a sequence, or call maintenance.
Build these working templates:
- A3 problem sheet: Record the problem, baseline, suspected cause, evidence, countermeasure, owner, and result. Keep the cause separate from the proposed solution.
- Standard-work sheet: Add photos, sequence, critical quality checks, safe operating requirements, and exception rules. Include the revision date and approval owner.
- Suggestion log: Capture problem, location, frequency, suspected cause, countermeasure, owner, and result. Review repeated patterns rather than collecting suggestions without decisions.
Operator involvement deserves a formal mechanism. A study of employee participation in lean manufacturing examined involvement and knowledge capture across manufacturing sites, supporting the importance of preserving what workers learn during improvement.
Protect the Result After Handover
Watch for familiar traps: pushing utilization while orders queue, expanding across every cell, skipping Control, and validating the change only on day shift. Each needs an explicit management response, not another awareness session.
Ownership test: Who updates the standard and resolves exceptions after the consultant leaves?
If the answer is nobody, a technology-led rollout isn't right for your plant yet. Assign that responsibility before expanding the pilot. Then check whether the revised process reduces errors and whether new operators can learn it without relying on undocumented shortcuts.
Choose One Cell and Start the Thirty-Day Clock
Use the opening month to establish evidence and run a controlled change. Don't promise a plantwide transformation on that schedule.
Put the Work on the Calendar
- Week 1, select and observe: Choose the late or high-scrap family. Walk an order, sketch the waits, and include office approvals. Ask operators which conditions make the normal sequence impossible.
- Week 2, establish the baseline: Record lead time, waiting, first-pass yield, and on-time delivery consistently. Select the method that fits the observed constraint, and identify any missing evidence.
- Week 3, authorize the pilot: Write the problem statement and agree on the primary metric. Staff the work with people who operate, maintain, inspect, and schedule the cell. Confirm who can approve changes and stop an unsafe test.
- Week 4, test and review: Run the first intervention, post the provisional visual standard, and review results with every shift. Record exceptions rather than changing the rules to make the test look successful.
That's a recommended working calendar, not a claim that every process will improve within a month. Some problems need more observation, maintenance work, or measurement-system correction before a valid test is possible.
Know When to Pause
If master data is wrong, fix the affected records before using them to schedule or automate decisions. If nobody owns the standard, assign an owner before buying technology. Continuing anyway only makes it harder to distinguish a process problem from a system configuration problem.
Keep your commercial team involved without asking sales to invent demand for theoretical capacity. Give estimators the observed lead-time range, tell account managers which promises the pilot can support, and distinguish available capacity from capacity already committed.
Shorter, reliable lead time can support more credible quotes and better customer conversations. It doesn't automatically create orders. You still need follow-up, clear positioning, and a growth plan that matches what production can deliver.
Name the cell, the owner, and the primary metric today. Put the first observation on the calendar and make the team's next decision depend on evidence rather than enthusiasm.
Machine Marketing helps manufacturers connect operational readiness to CRM follow-up, industrial content, and a growth plan tied to delivery performance. Once you've named your pilot and its primary metric, visit Machine Marketing to discuss a diagnosis that connects that operational result to your sales pipeline.
