
Quotes are getting tougher to win, material prices are squeezing margins, and the shop is still expected to hit the same delivery dates. The easy answer is to cut budgets or labor. The useful answer is to find out where each dollar goes, then fix the cost driver that's limiting profit without damaging quality or service.
We recommend treating cost reduction as a sequenced operating system: measure first, improve the process next, and approve strategic or capital changes only when the numbers support them. That's how to reduce manufacturing costs without mistaking a lower purchase price or smaller payroll for a healthier operation.
Table of Contents
- Why Most Cost Reduction Programs Stall on the Shop Floor
- Diagnose Your Real Cost Drivers Before Cutting Anything
- Quick Wins You Can Capture in 30 Days With Little or No Capital
- Lean, SMED, and TPM as One Connected System
- Procurement and Supplier Strategy That Survives the Next Shock
- Design for Manufacturability and Automation ROI
- Your 90-Day Implementation Roadmap and KPI Dashboard
Why Most Cost Reduction Programs Stall on the Shop Floor
A cost program stalls when leaders pick savings tactics before diagnosing the work. Cutting headcount, squeezing suppliers, and asking operators to move faster may lower a line item, but they can also increase overtime, defects, downtime, and missed deliveries. The cost didn't disappear. It moved.
Three failures show up repeatedly. First, teams start with a target rather than a baseline, so they can't tell whether a change created savings. Second, they focus on visible costs and miss setup delays, scrap, rework, excess movement, idle equipment, and indirect spending. Third, procurement, production, maintenance, and energy teams run separate initiatives, even though those costs often interact.
Start with the system, not the cut
We'd run the work as a 90-day improvement cycle. Establish a current-state baseline, identify the dominant cost driver, and assign an owner to each improvement. Then check whether the change reduced total cost per unit without hurting throughput, quality, or delivery.
That order matters because the cheapest-looking intervention can create downstream expense. A supplier price reduction may raise defects or lead-time risk. A faster machine cycle may create more scrap. A labor cut may leave a bottleneck without enough coverage.
Indirect spending also deserves a deliberate review. McKinsey's analysis of 24 industrial companies found that structured cost-optimization programs could reduce indirect costs by 15% to 20% within 12 to 18 months, without relying exclusively on machine purchases or headcount reductions (McKinsey's analysis of indirect cost reduction). That's a reminder to examine procurement, logistics, maintenance support, engineering administration, and other indirect expenses alongside production.
Operating principle: Reduce waste in the process before reducing the capacity that makes the process work.
The practical sequence is straightforward: diagnose the cost stack, act on its largest controllable driver, and protect the gains with standard work and clear ownership. Cost reduction should improve the operating system, not make it more fragile.
Diagnose Your Real Cost Drivers Before Cutting Anything
A shop can't choose the right fix until it knows what makes each product expensive. Start with seven drivers: material, direct labor, machine time, setup, quality, energy, and overhead. Their mix changes by product family. A high-volume part may be dominated by material yield or cycle time, while high-mix work may carry more setup and scheduling cost.
Build a simple worksheet from records you already have. Pull labor and machine hours from your ERP, job travelers, or clocking system. Allocate shared overhead by machine hour as a first-pass method, then rank each driver by its share of unit cost. Don't treat that allocation as perfect. Treat it as a consistent way to identify where better measurement is needed.
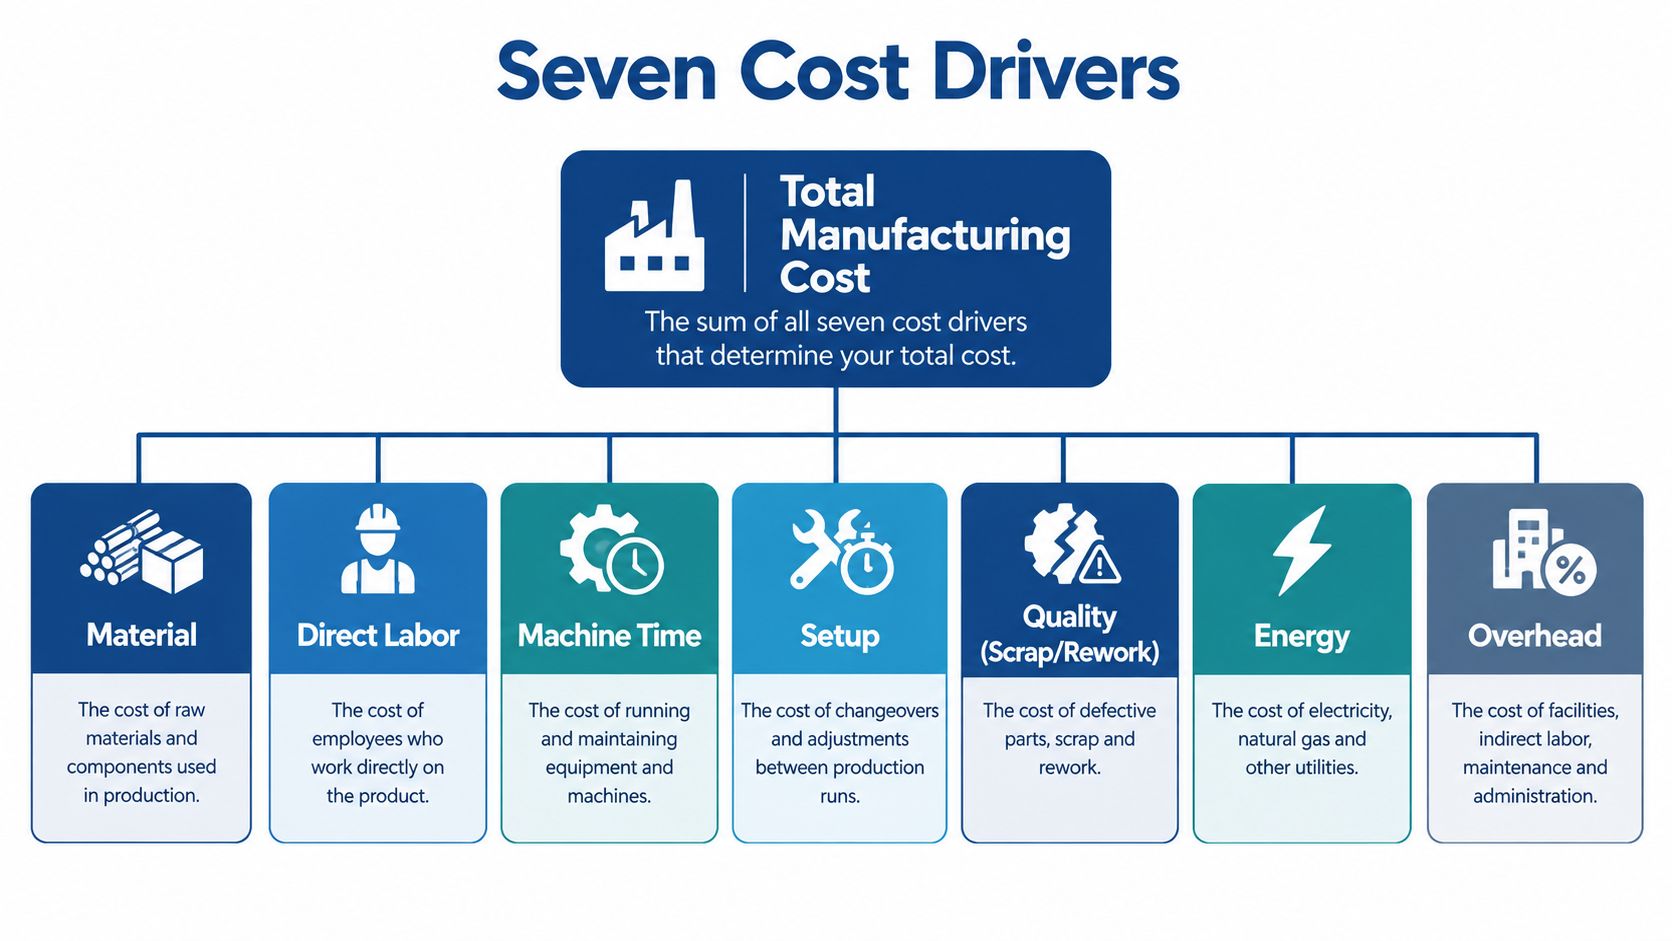
Cost-Driver Diagnostic Worksheet
| Cost Driver | How to Measure | Data Source | Typical Signal |
|---|---|---|---|
| Material | Material issued per good unit, including scrap | Bills of material, purchasing, inventory | High usage, price variance, or excess scrap |
| Direct labor | Paid hours per good unit | Payroll, job clock, labor reporting | Overtime, waiting, or uneven workload |
| Machine time | Run time and idle time per good unit | Machine logs, job records | Bottleneck queues or underused capacity |
| Setup | Changeover hours per production run | Setup sheets, operator records | Long changes or avoidable adjustments |
| Quality | Scrap and rework by product or process | Nonconformance and inspection records | Repeat defects or recurring repair work |
| Energy | Utility use against production output | Meters, utility bills, production records | High use during idle or low-output periods |
| Overhead | Shared costs allocated consistently | General ledger, ERP, machine-hour basis | Rising indirect spend or weak cost ownership |
Industrial engineering guidance favors starting with high-volume products, bottleneck operations, setup reduction, product simplification, and production-flow redesign. It also cautions that the lowest-price supplier may not be the lowest-cost choice if its material brings more defects, longer setups, or unreliable delivery (industrial engineering guidance on product and process cost).
Use the worksheet to compare opportunities, not to justify a predetermined cut. If maintenance expense is a major contributor, this practical guide to how to reduce plant maintenance expenses can help you frame the review around avoidable work and equipment reliability. For a repeatable approach to diagnosing the problem, use this problem-solving framework to define the issue, test causes, and verify results.
Quick Wins You Can Capture in 30 Days With Little or No Capital
The first month should produce verified improvements, not a list of recommendations. Begin with the waste that costs little to fix: idle equipment, incorrect settings, compressed-air leaks, poor scheduling, and inconsistent operating practices.
DOE Industrial Assessment Centers evaluated 568 small and medium manufacturers in 2022 and identified 3,692 energy-saving opportunities. Of those opportunities, 48.7% required less than $5,000, 36.1% had payback under one year, and 57.9% required fewer than eight labor hours to implement (DOE Industrial Assessment Center findings). The pattern supports a staged approach: measure, correct operating waste, verify, and only then consider equipment replacement.
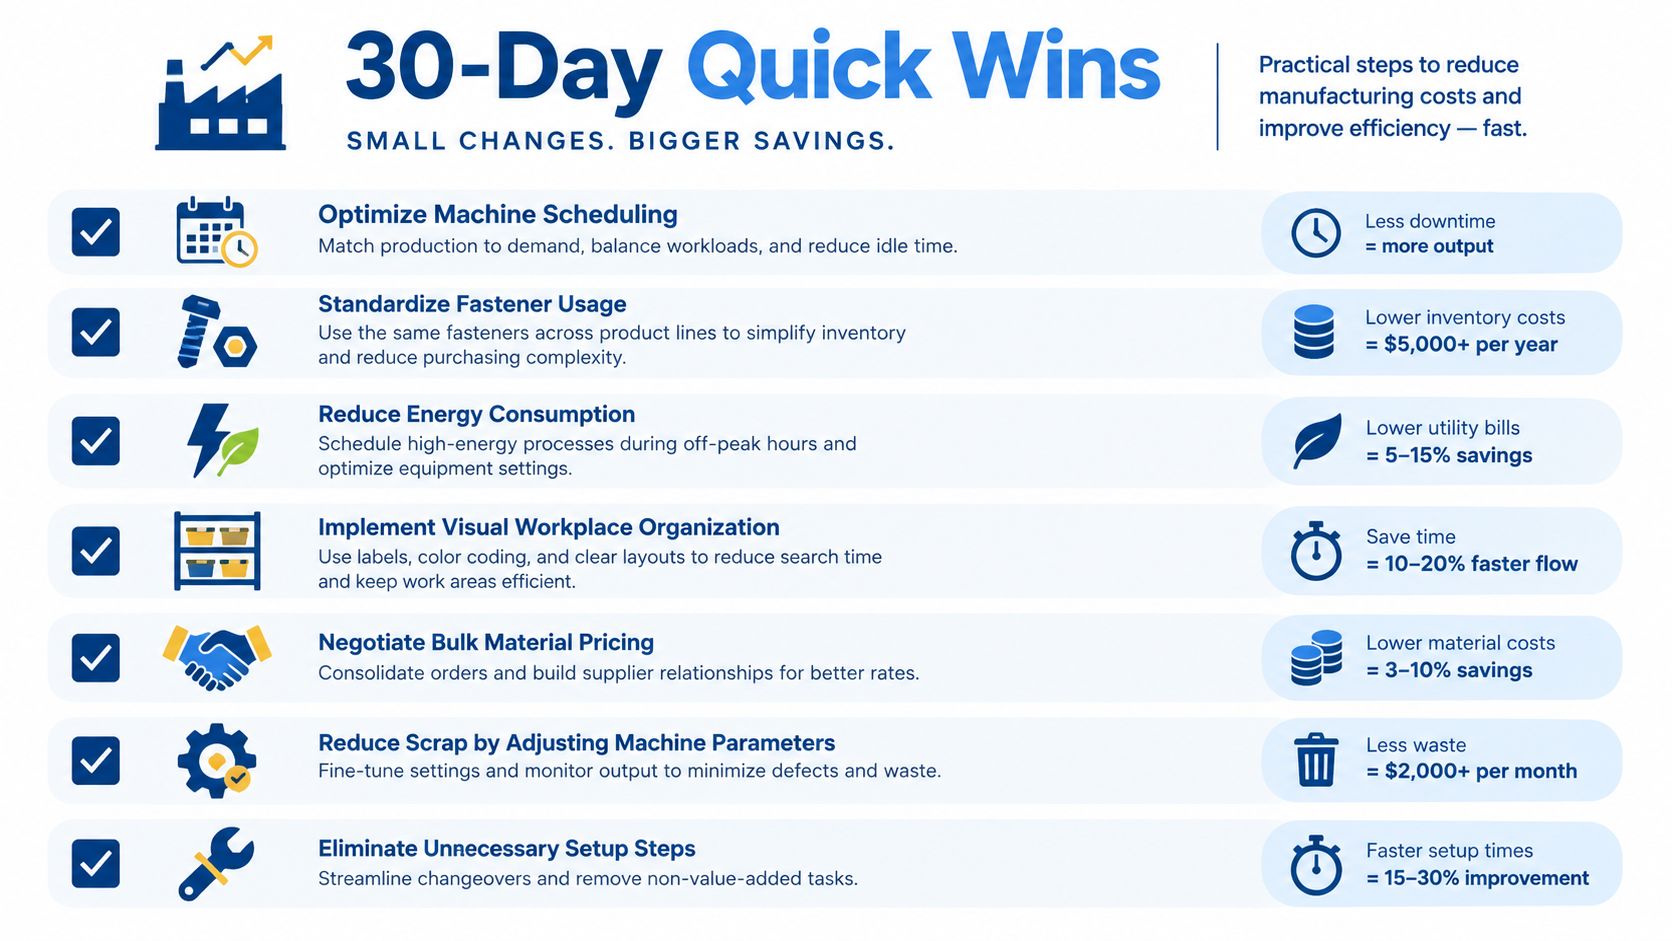
A practical first-month checklist
- No-cost operating changes: Align machine schedules with production demand, shut down equipment when it isn't needed, review setpoints, and standardize approved operating procedures.
- Low-cost repairs: Find and repair compressed-air leaks, fix damaged insulation, and correct maintenance issues that waste energy or interrupt production.
- Process housekeeping: Use visual workplace organization to keep tools and materials at point of use. Remove unnecessary setup steps and document the best-known method.
- Verify the result: Compare utility use, output, downtime, and quality against the baseline. A completed recommendation isn't a realized saving.
- Protect the change: Set clear limits for operator adjustments and explain when to escalate a process problem instead of overriding a setting.
Don't compare utility bills without accounting for production volume and operating hours. Check tariff structure and seasonal charges, too. Otherwise, a shift in demand or schedule can look like a process improvement when it isn't.
The first month should leave you with a short list of implemented changes, named owners, and measured results. That evidence gives the team a sound basis for prioritizing larger process or capital projects.
Lean, SMED, and TPM as One Connected System
Lean, SMED, and TPM work best as connected methods, not separate improvement campaigns. Value-stream mapping shows where material and information wait, move, or return for rework. SMED, or Single-Minute Exchange of Die, targets changeover time so the shop can run smaller batches without paying for long setups. TPM, or Total Productive Maintenance, helps keep equipment reliable so the improved flow doesn't collapse under breakdowns.
The order matters. Map the current process first. Identify the bottleneck and its causes. Reduce setup work, stabilize the equipment, then redesign the flow around what the process can reliably produce.
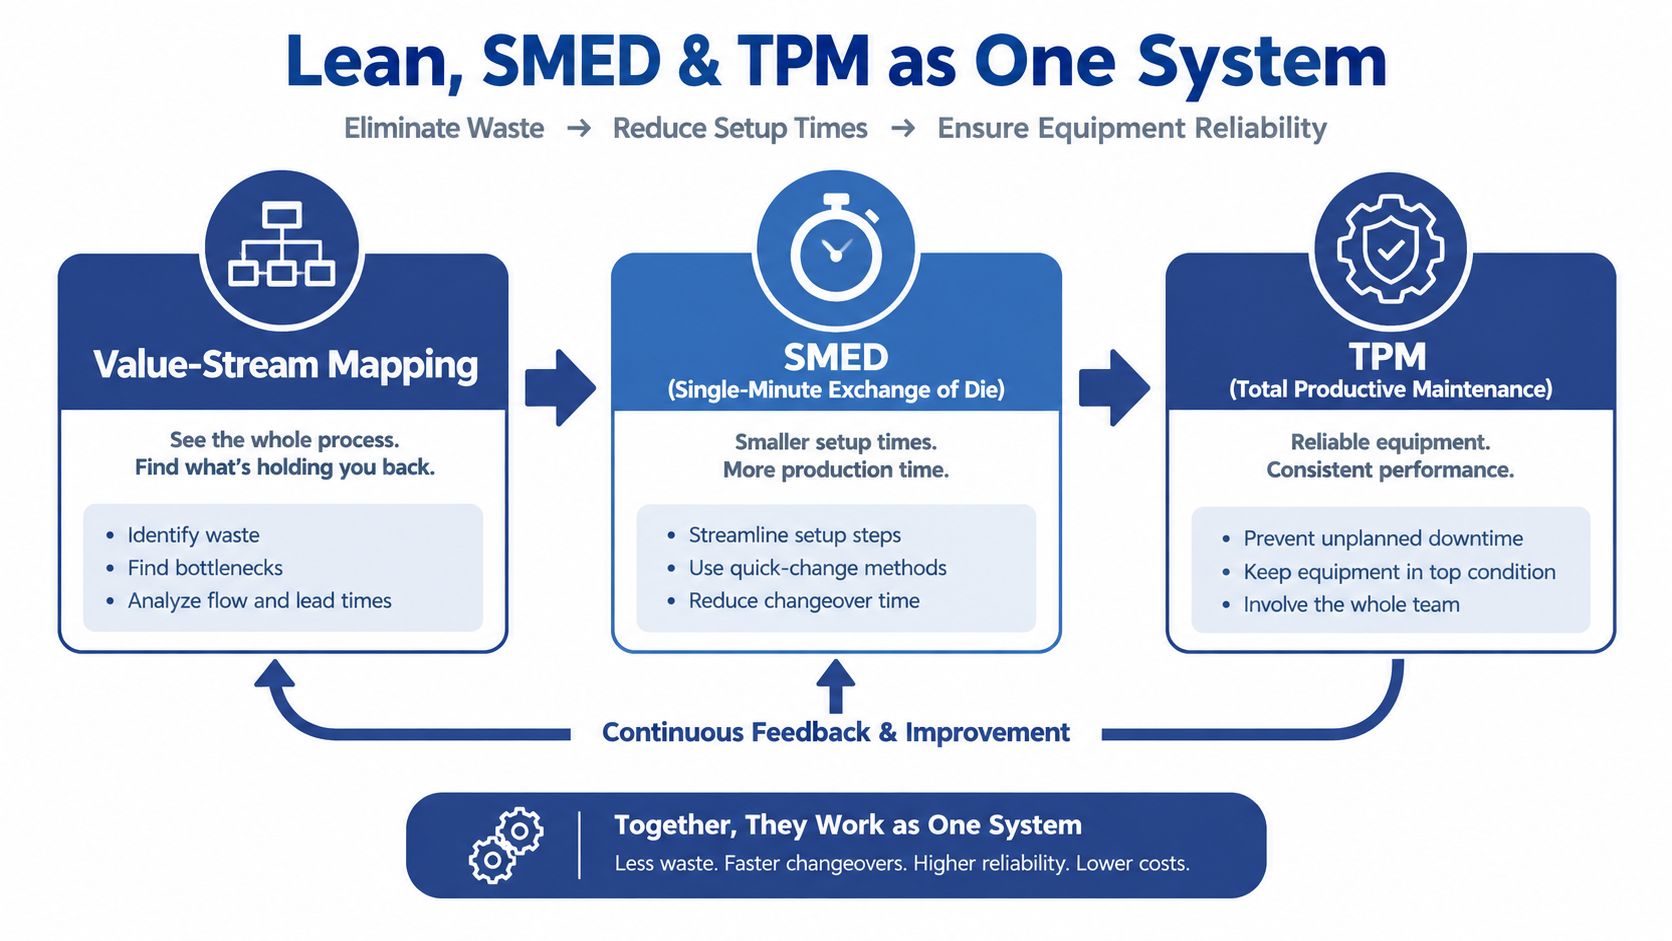
Measure the combined effect
A Purdue University graduate study combined value-stream mapping with targeted process improvements. The project reached a future-state cycle time of 23 days, a 45% reduction, alongside a 28% reduction in labor costs, 60% less time lost to production anomalies, and 24% fewer nonconformances. The analysis estimated $2.3 million in savings per interceptor (Purdue University graduate study on value-stream improvements).
Those results are specific to that project, not a promise or universal benchmark. Their value is the lesson: measure across the full value stream. Faster flow, fewer defects, reduced disruption, and labor savings can reinforce one another.
Don't automate or speed up a process you haven't stabilized. You may only produce defects faster.
After mapping, make setup reduction practical. Separate tasks that can be done while the machine is running from tasks that require it to stop. Standardize tools, fixtures, and setup checks, then record the method in an SOP operators can use. For TPM, make basic cleaning, inspection, and escalation part of routine work, with maintenance responsible for diagnosing repeat failures.
When downtime is a recurring cost driver, consider how condition monitoring could help your team move from reactive repairs to planned action. This overview of predictive maintenance evidence for operations leaders offers a useful starting point for evaluating that approach.
Procurement and Supplier Strategy That Survives the Next Shock
A lower quoted price isn't a saving if it increases freight, defects, inspection, or downtime. Evaluate suppliers using risk-adjusted landed cost, not purchase price alone. The comparison should include freight, material quality, lead-time variability, minimum order quantities, payment terms, and the production impact if a shipment fails to arrive.
| Supplier factor | What to compare | Cost or service question |
|---|---|---|
| Purchase price | Quoted price and contract terms | Is the saving still meaningful after added costs? |
| Freight | Shipping mode and delivery expense | Will the price require more expensive transport? |
| Defects | Incoming and in-process quality | How much inspection, scrap, and rework could follow? |
| Lead-time variability | Actual delivery patterns | Can production schedules absorb the variation? |
| Minimum order quantity | Required order size | Will larger buys tie up cash or create excess stock? |
| Downtime exposure | Consequence of a missed delivery | Could the part stop a bottleneck or critical process? |
| Recovery time | Time to restore supply after disruption | Is there a credible alternative source or recovery plan? |
Recent manufacturing outlook research reports that manufacturers expect input costs to rise by about 5.4% over the following year and are responding with front-loaded inventory, sourcing changes, and digital tools to assess exposure and tariff risk (manufacturing industry outlook on input costs and supply response). That pressure makes resilience part of cost management, not a separate concern.
Match protection to component criticality
Don't duplicate every supplier or stock every part “just in case.” Classify components by how critical they are to production and how difficult they are to replace. For a critical item with long recovery time, a qualified alternate source or carefully sized safety stock may be justified. For a readily available, noncritical item, extra inventory may tie up cash.
Consolidation and just-in-time purchasing can reduce purchasing complexity and inventory costs, but they can also increase disruption exposure. The answer isn't maximum redundancy. It's deliberate redundancy where the cost of a stoppage outweighs the cost of a backup.
Review supplier performance with purchasing and operations together. A supplier's delivery record, material quality, and response during a disruption can matter more than a small difference in unit price. Rebid high-cost items when the total-cost analysis shows a real opportunity, and document the trade-off before changing the source.
Design for Manufacturability and Automation ROI
Before buying a robot, fixture system, or new machine, ask whether the product and process are unnecessarily difficult to make. Design for manufacturability (DFM) can remove cost at its source: reduce part count, standardize fasteners, review machining tolerances, and specify materials and features that suppliers can produce reliably.

Then evaluate tooling and automation against the process you need. Automation is a poor first move when work is highly variable, the process is unstable, or the data needed to verify savings doesn't exist. A machine can reduce manual handling and improve consistency, but it can't make an unreliable process dependable by itself.
Use a payback screen
Rank each capital idea by annual savings, implementation cost, production risk, and payback. Prioritize projects with payback under 24 months, then assign an owner to verify the result against the current-state baseline. For energy projects, track production output, uptime, maintenance cost, and energy intensity so a utility saving doesn't conceal a production loss.
DOE plant assessments identified approximately $201 million in potential annual savings across 40 industrial facilities, with plants already realizing more than $81 million annually. Average project payback was generally below two years and often below one year (DOE plant assessment results). Those findings support disciplined screening, not buying equipment because a projected saving looks attractive.
Use this order: DFM first, then low-cost tooling and fixturing, then automation where the workload and verified economics justify it. If you're evaluating electronics assembly as part of a product or process redesign, this 2026 assembly guide can help frame the manufacturing considerations. For a broader look at where automation may fit, review this guide to manufacturing process automation.
Your 90-Day Implementation Roadmap and KPI Dashboard
Make the work visible and give each phase an owner. The roadmap below keeps early savings tied to measured results and delays major capital decisions until the shop has a sound baseline.
Put the work on the calendar
- Days 1 to 30: Baseline unit cost and utility use, complete the cost-driver worksheet, and implement low-cost operating fixes. Assign a production owner and a maintenance or energy owner.
- Days 31 to 60: Map the value stream, identify the bottleneck, and test setup reductions. The production manager should own the trial; operators and maintenance should help document the standard.
- Days 61 to 75: Compare supplier risk-adjusted costs and review product designs for manufacturability. Purchasing owns supplier comparisons, while engineering and operations assess redesign opportunities.
- Days 76 to 90: Screen capital proposals against savings, implementation cost, risk, and payback. Review KPI movement with the leadership team and decide which changes to standardize.
Track cost per unit, OEE, setup time, scrap and rework, on-time delivery, energy per unit, and indirect spend as a share of revenue. Assign a named owner, target, and review cadence to every measure. Daily review suits production signals such as downtime and scrap; broader cost and spend measures need a regular management review.
Facilities with existing energy-management programs can often save an additional 10% to 15% by applying best practices identified during plant assessments. Manufacturers implementing recommendations from Industrial Assessment Centers save an average of $55,000 annually (DOE guide to plant energy assessments). Treat those figures as evidence for measurement and follow-through, not guaranteed results for your facility.
Before approving the next action, check for four failure modes: recommendations counted as savings before verification, settings overridden without documentation, effort aimed at a secondary cost driver, and capital approved before the process is fixed. A consistent operating cadence helps keep ownership clear; this overview of EOS Traction for manufacturers can help structure that accountability.
If your dashboard shows a gap, don't respond with a blanket cut. Return to the cost-driver worksheet, confirm the baseline, and choose the next intervention that protects quality and delivery while lowering total cost.
Machine Marketing helps manufacturers build connected growth strategies, from industrial SEO and content marketing to CRM and automation planning. If you want a practical diagnosis of where your operation's cost story can support stronger business growth, visit Machine Marketing and start a conversation with our team.
